Appearance & Measurement Experts since 1986
For many end-use products including food packaging, medical devices and transparent household and cosmetic containers, Polypropylene (PP) is a natural choice over many other materials due to its low cost, excellent mechanical properties and easy processing.
However, neat PP is translucent or opaque due to the particular semicrystalline arrangement of the polymer chains which presents an obstacle for its use in applications requiring maximal see through quality. By using so-called ‘clarifying agents’ as additives, the optical transparency of PP and several other commodity polymers can be conveniently improved to, essentially, match that of glass or amorphous plastics, without compromising its superior mechanical properties.
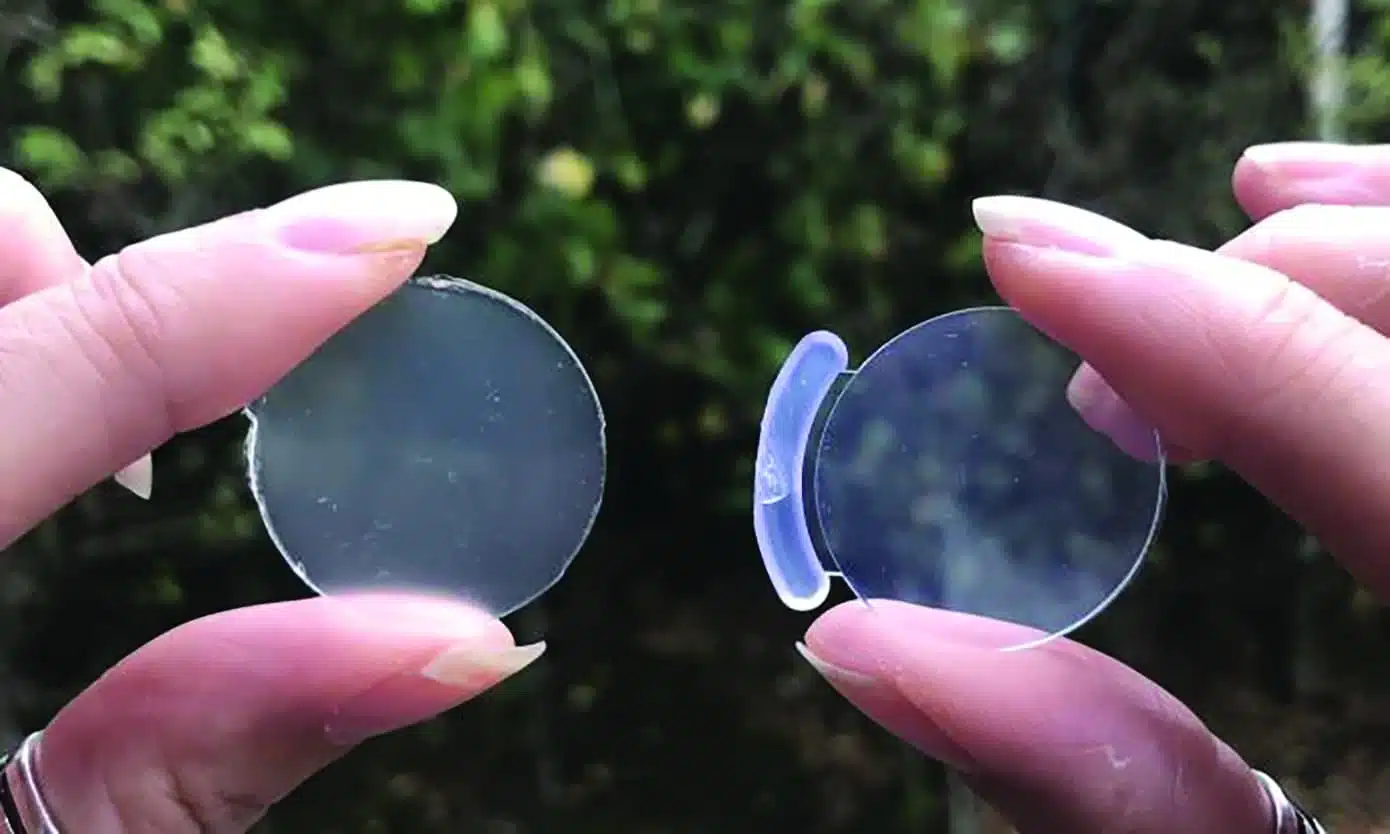
The image shows two PP samples:
one containing a clarifying agent (right) and the other in its neat, unblended form (left).
The image viewed through the sample features the highest contrast and sharpness of details.
The resulting transparent characteristics of PP are strongly dependent on a number of factors; most importantly: the specific clarifier used, its concentration and processing temperature. To ensure an optimal trade-off between the required transparency and cost increase via the use of expensive additives, haze and other transparency metrics are commonly measured during process development and production phases.
Rhopoint ID enables this analysis with an unprecedented level of detail and precision.
Example – PP samples with varying clarifier content
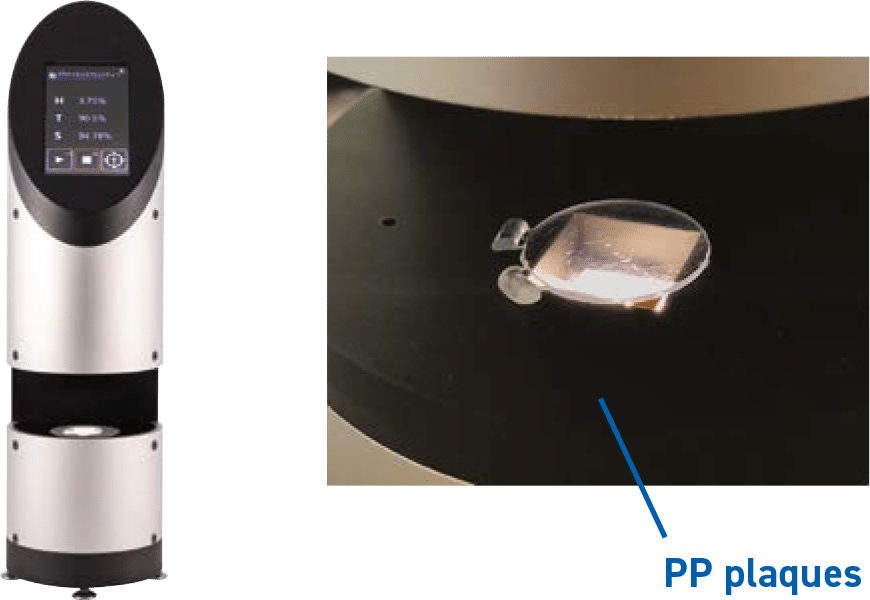
Ten injection-molded PP plaques were used to analyse the effect of a varying content of a sorbitol-based clarifying agent on the resulting transparency. Each sample was individually tested using Rhopoint ID-L to provide the respective values of Haze (HID), Sharpness (S) and Visible Transmittance (VT).
Reference measurements of ASTM Haze (HASTM) were performed using a sphere-based ASTM D1003 haze-meter.
STEP 2: Rhopoint ID-L software allows to observe and quantify the changes in optical transparency.
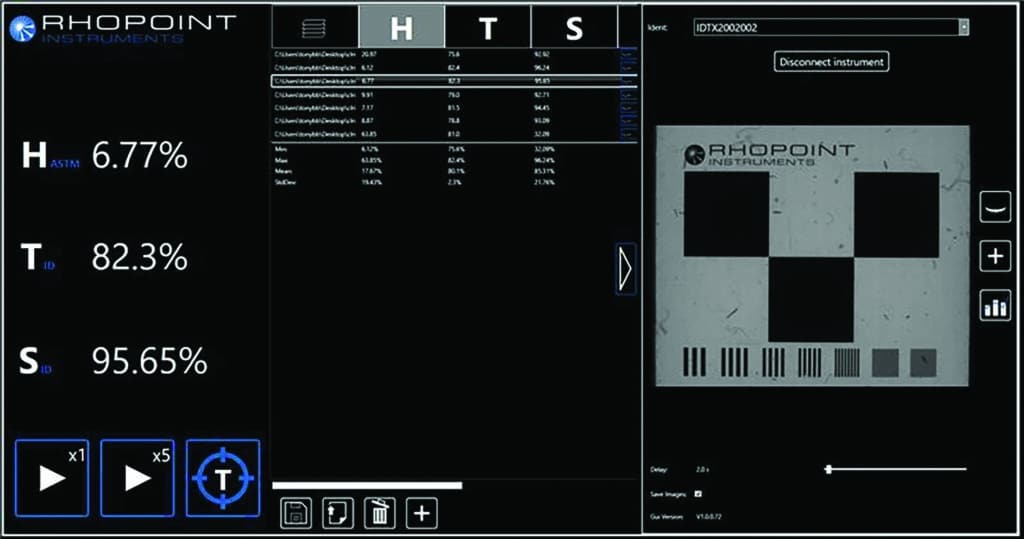
STEP 3: Images and data are collected for all samples.
Example – PP Samples with varying clarifier content
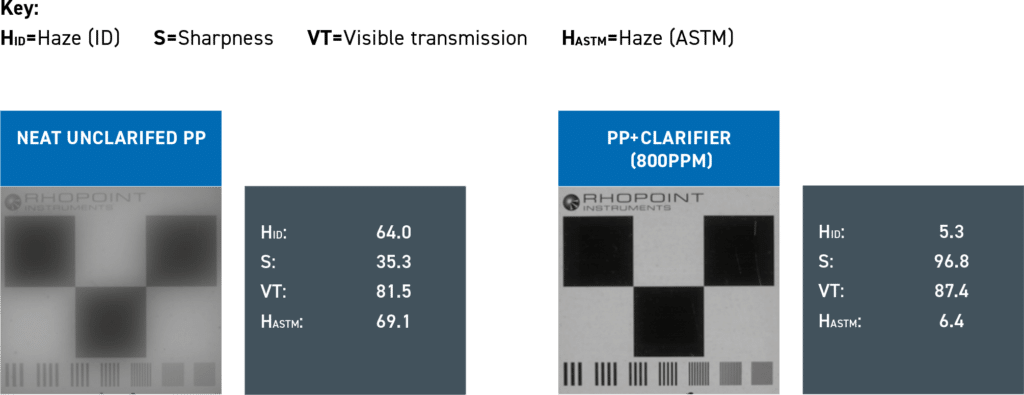
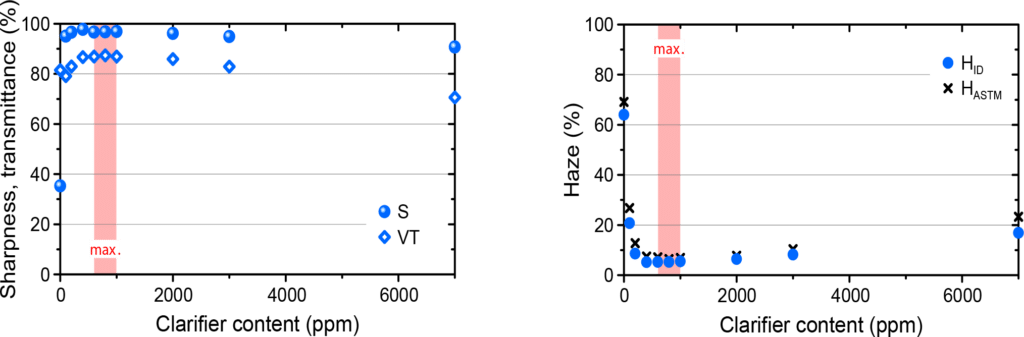
The data below shows zoomed-in views of the graticule, haze (ID and ASTM), sharpness and visible transmittance for PP samples with varying clarifier content. The sample range featuring exhibiting maximal transparency is highlighted.

Maximum transparency (i.e. lowest haze and highest sharpness and visible transmittance) is observed for a narrow, 600–1000 ppm concentration range of the clarifier, as shown by the highlighted data regions.
A close correspondence is found for the ID- and ASTM haze data.
Comparison of data and graticule images confirms that the quantitative analysis correlates closely with the visual perception of transparency.
The measurement results provide valuable data to determine the haze variation and the maximum peak haze value of the film over a distance range. The addition of images allows visual comparison of each measurement due to the change in distance. Matching the material exactly to the application allows quality improvements and cost savings.
RESULTS – Advanced transparency analysis content
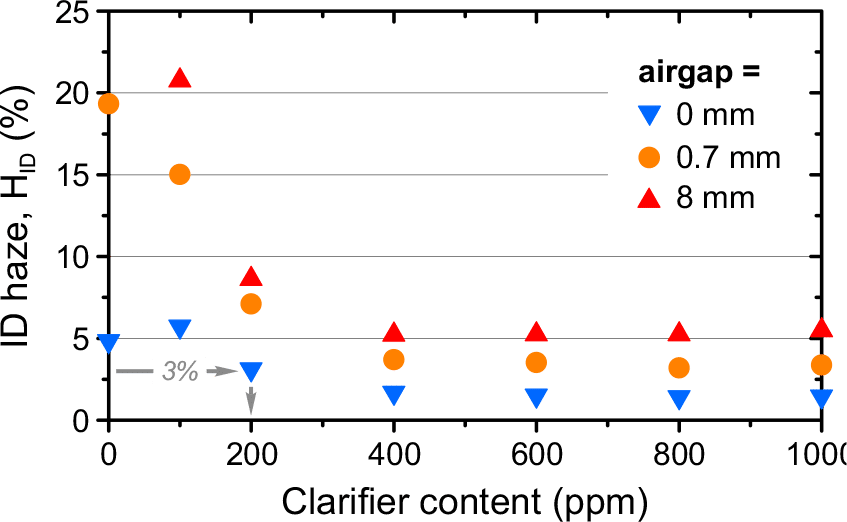
If the material is intended to be used in contact for packaging applications and an upper limit of haze = 3% is required then the analysis determines the optimal clarifier content of 200 ppm.
In comparison, sphere-based hazemeter measurements provide an airgapidependent optimal value of 800 ppm. Hence, Rhopoint ID-L enables substantial cost savings by allowing to minimise the use of expensive additives.
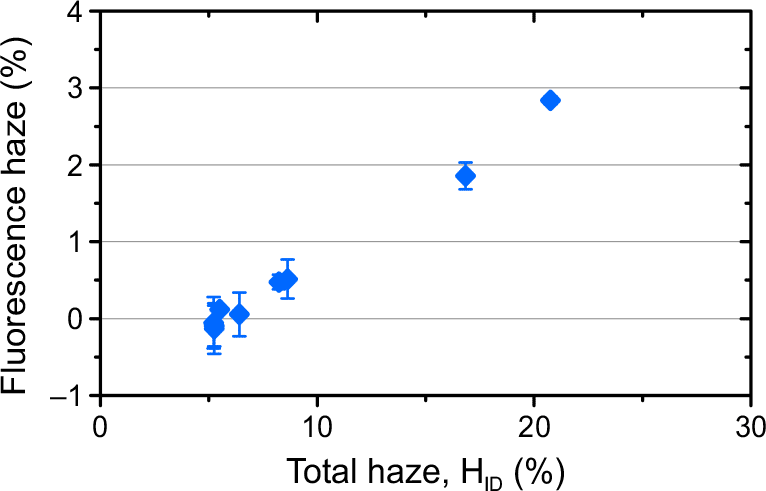
Here it is shown that the particular whitener used in the commercial clarifying agent contributes an appreciable fraction of ‘fluorescence haze’ to the total haze.
Hence, Rhopoint ID-L allows to optimise material formulations for application-specific lighting and viewing conditions.
Fluorescence haze vs total haze for PP samples with varying clarifier content.
Further details and examples can be found in the article in Macromolecular Materials & Engineering.