Appearance & Measurement Experts since 1986

+44(0)1424 739 622

Table of Contents

FAQ Categories

Rhopoint ID Application Notes – Abrasion on transparent materials

Rhopoint ID Application Notes – Abrasion on transparent materials

Overview

Transparent materials such as acrylic (PMMA), polycarbonate (PC) and glass play an important part in our every day life. They are commonly used in a wide range of industries including electronics, packaging, building, medical, automotive and aerospace.

According to their function, these materials are generally required to allow an undistorted and visually clear image of the content that is behind. In some applications it can be critical for safety reasons and for others, to allow excellent viewing quality of products and/or information. Indeed some applications require a combination of obscurity and full transparency for instance smart glass. For each application the correct selection of polymers and resins used to manufacture the material is essential in ensuring optimum mechanical and physical properties.

Abrasion resistance of PMMA and PC presents challenges to the manufacturer and may require modifications to be made to the polymers or the use of coatings on the surface to improve wear characteristics.

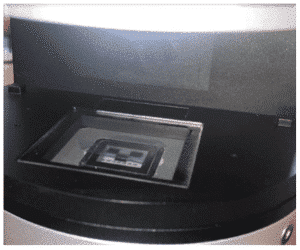
Taber Model 1700
Image courtesy of Taber Industries

To simulate wear, a test method – the Taber Abrasion test to ASTM D1044 utilising CS-10F wheels was adopted. Taber tests involve mounting a flat to a turntable platform that rotates on a vertical axis at a fixed speed. Two abrasive wheels, applied at a specific pressure, traverse a complete circle on the specimen surface. The resulting abrasion marks form a pattern of crossed arcs in a circular band that cover an area approximately 30 cm2. At the end of the test, the change in transparent quality, mainly haze, is measured using a hazemeter.

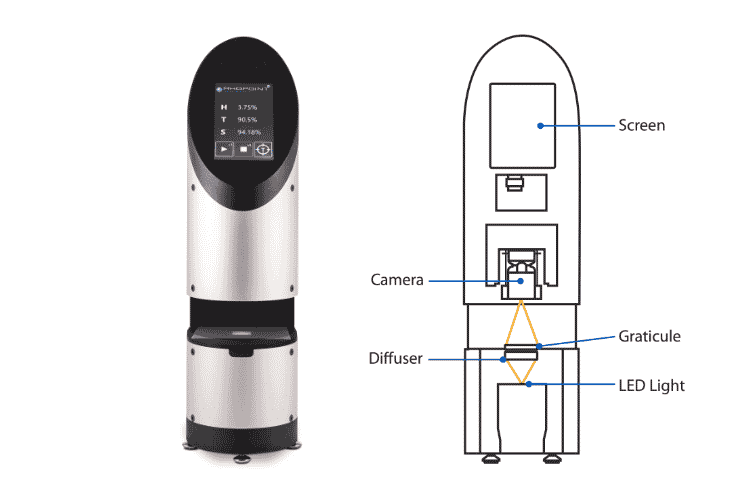
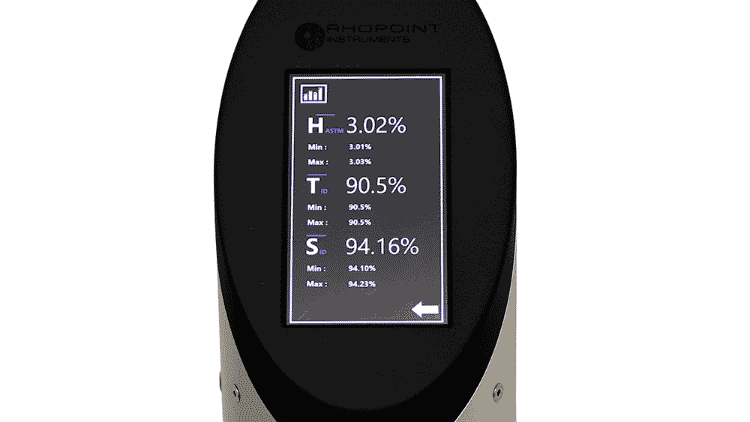
As the orientation of a hazemeter conforming to ASTM D1003 is typically horizontal, a special mounting adaptor needs to be used to hold the sample to the measurement port. The Rhopoint ID, thanks to its high correlation to ASTM D1003 is a vertically oriented instrument making sample mounting quick and very easy allowing compatible measurements to now be made.

Process

Example – PMMA

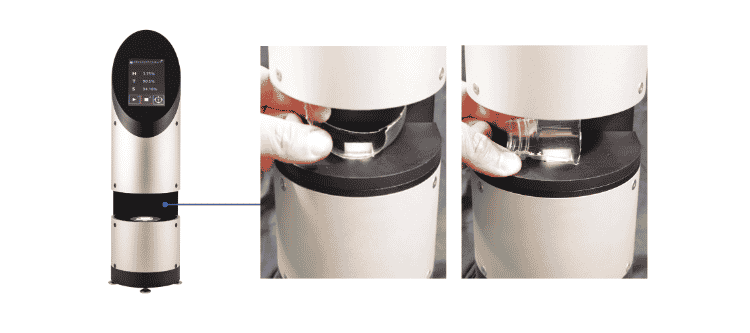
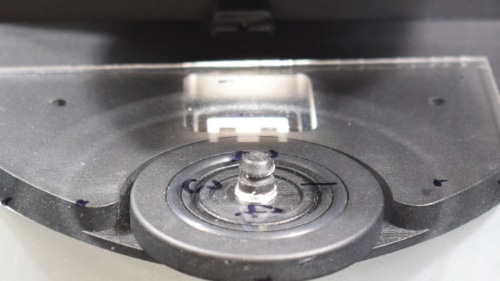
STEP 1: Customer supplied samples of rotary abraded (using Taber Model 1700) and non-abraded PMMA material were tested. The Abrasion Adaptor, available as an optional accessory, allowed the samples to be mounted and easily rotated over the graticule for ASTM equivalent haze (HASTM) measurement.

Quadrant 1
Quadrant 2 Close up

STEP 2: The abraded sample was mounted onto the table and a measurement taken.

Quadrant 3
Quadrant 4

STEP 3: The table was then sequentially rotated 90 degrees each time and further measurements made. This process was then repeated for the non-abraded sample for comparison.

Results

Example – PMMA

Abraded Sample

Non-abraded Sample

Observations of results

The measurement data shows the reduction in optical quality due to Taber abrasion. The abraded sample shows a higher Haze and lower Sharpness value indicating surface roughness is present; the hardness of the material surface being insufficient over the test cycle to withstand the abrasion. Matching the material formulation to the application allows quality improvements and cost savings.

Features of the Rhopoint ID

Rhopoint ID Application Notes – Blister Packaging

Rhopoint ID Application Notes – Blister Packaging

Overview

Blister Packaging, a versatile pre-formed plastic packaging material, is used in a number of different industries including consumer goods, electronics, and pharmaceuticals.

A thermo forming process is used to create a cavity or pocket made from a formable transparent plastic web, the size and shape of which is determined by the product for which it is required. This cavity or pocket is typically heat sealed onto an adhesive coated cardboard or foil to trap the contents in place underneath creating a typical blister pack.

There are many types and variations of blister packs that are used, selected according to the product requirements. Some types like face seal blisters incorporate a flanged blister to surround the product, which is heat sealed onto piece of cardboard, the seal therefore is only on the flange while the rest of the cardboard stays uncovered (usually printed).

Others like the clamshell blister pack incorporates the blister in a hinged two half container that opens and closes, due to its robustness it is therefore suitable for heavy products.

Whichever type of blister packaging is used, clear undistorted visibility of the contents is essential, not only from and aesthetic point of view of the product underneath, but in pharmaceutical applications critical to allow the pharmacist to visually check markings on the individual doses of medication.

The thermo forming method used to create the cavity is therefore a critical stage in the process as there are several factors that can influence the optical quality of the blister. Material selection, forming temperature and mould condition all need to be correctly controlled to prevent substandard end products being produced.

Due to the complex shape of this type of packaging, visual quality checks of the blister windows have mostly been used as it has been impossible to perform measurements using traditional sphere-based transmission hazemeters. Thanks to its innovative design, the Rhopoint ID overcomes this issue providing a powerful measurement solution for quality control.

Process

Example – Evaluating high clarity blister packs

STEP 1: A manufacturer of pharmaceutical blister pack materials supplied five samples from their different worldwide manufacturing locations for analysis. The manufacturer was concerned about the wide variation of visual quality of materials from each location and issues that could be caused due to variations in optical clarity.
Blister material seated on the measuring pane

STEP 2: The samples were mounted onto the surface roughness and small parts ASTM (8mm) adaptor on the measurement graticule to obtain results compatible with ASTM D1003.

The complex shape of the blister material did not present any problems during measurement as there was sufficient coverage of the material over the measurement graticule of the Rhopoint ID.

STEP 3: Each sample was measured 4 times over the surface area using Rhopoint ID-L to obtain results for Sharpness (S) and Haze (HASTM).

Results

Example – Blister Packs

Measurement Results

A total time of 20mins was taken to measure all samples (4 times x 5 samples – 20 measurements) each of which were manually manipulated during measurement.

Using the Rhopoint ID-L software the measurement data and images were then analysed to identify changes in optical quality. Average results were calculated and used for the purpose of this report.

SAMPLE 1 / CONTROL 1
Sharpness: 83.72
Haze: 5.03
SAMPLE 2 / CONTROL 2
Sharpness: 83.96
Haze: 4.58
SAMPLE 3 / LOCATION A
Sharpness: 7.66
Haze: 27.60
SAMPLE 4 / LOCATION B
Sharpness: 9.02
Haze: 24.8925
SAMPLE 5 / LOCATION C
Sharpness: 47.86
Haze: 9.915

Observations of results

Analysing the results, the variation of Haze and Sharpness across the samples could be observed.

Looking in detail at the images for Samples 3 – 5 there appeared to be a texture present on the surface causing a distortion (when viewed at the point where the black and white areas of the measurement graticule meet). This texturing appears higher on Samples 3 & 4 (resulting in a higher haze and lower sharpness) due to the smaller size of the texture whilst on Sample 5, due to the texturing being larger, the haze is lower and sharpness higher.

The ability to obtain numeric and image data from the Rhopoint ID allows visual confirmation of the data.

As previously mentioned the measurement of these samples, due to their shape and size, would have been impossible using a traditional hazemeter.

Features of the Rhopoint ID

Rhopoint ID Application Notes – Clarifying Plastics

Rhopoint ID Application Notes – Clarifying Plastics

Overview

For many end-use products including food packaging, medical devices and transparent household and cosmetic containers, Polypropylene (PP) is a natural choice over many other materials due to its low cost, excellent mechanical properties and easy processing.

However, neat PP is translucent or opaque due to the particular semicrystalline arrangement of the polymer chains which presents an obstacle for its use in applications requiring maximal see through quality. By using so-called ‘clarifying agents’ as additives, the optical transparency of PP and several other commodity polymers can be conveniently improved to, essentially, match that of glass or amorphous plastics, without compromising its superior mechanical properties.

The image shows two PP samples:
one containing a clarifying agent (right) and the other in its neat, unblended form (left).

The image viewed through the sample features the highest contrast and sharpness of details.

The resulting transparent characteristics of PP are strongly dependent on a number of factors; most importantly: the specific clarifier used, its concentration and processing temperature. To ensure an optimal trade-off between the required transparency and cost increase via the use of expensive additives, haze and other transparency metrics are commonly measured during process development and production phases.

Rhopoint ID enables this analysis with an unprecedented level of detail and precision.

Process

Example – PP samples with varying clarifier content

STEP 1: The samples are mounted directly onto the ASTM spacer adaptor on the measurement GRATICULE.

Ten injection-molded PP plaques were used to analyse the effect of a varying content of a sorbitol-based clarifying agent on the resulting transparency. Each sample was individually tested using Rhopoint ID-L to provide the respective values of Haze (HID), Sharpness (S) and Visible Transmittance (VT).

Reference measurements of ASTM Haze (HASTM) were performed using a sphere-based ASTM D1003 haze-meter.

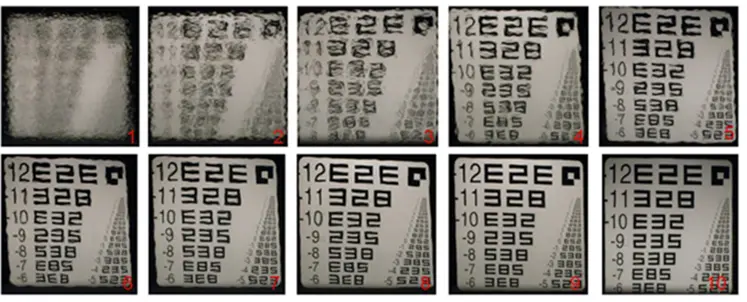
STEP 2: Rhopoint ID-L software allows to observe and quantify the changes in optical transparency.

STEP 3: Images and data are collected for all samples.

Results

Example – PP Samples with varying clarifier content

Exemplary images and data for two PP plaques: neat and optimally clarified

The data below shows zoomed-in views of the graticule, haze (ID and ASTM), sharpness and visible transmittance for PP samples with varying clarifier content. The sample range featuring exhibiting maximal transparency is highlighted.

Maximum transparency (i.e. lowest haze and highest sharpness and visible transmittance) is observed for a narrow, 600–1000 ppm concentration range of the clarifier, as shown by the highlighted data regions.

A close correspondence is found for the ID- and ASTM haze data.

Comparison of data and graticule images confirms that the quantitative analysis correlates closely with the visual perception of transparency.

Sharpness and Haze(%) vs Clarifier (ppm)

Observations of results

The measurement results provide valuable data to determine the haze variation and the maximum peak haze value of the film over a distance range. The addition of images allows visual comparison of each measurement due to the change in distance. Matching the material exactly to the application allows quality improvements and cost savings.

Results

RESULTS – Advanced transparency analysis content

In addition to the measurements above, Rhopoint ID-L can provide a more sophisticated analysis of transparency that is outside the capabilities of sphere-based haze meters. Identification and elimination of local defects This includes common defects such as dust, scratches and processing imperfections. By virtue of being an imaging-based technique, data can be obtained for the entire graticule or its individual regions to provide spatially-averaged or local values. Analysis of airgap-specific transparency Can be used to determine optimal, application-specific material formulations and processing conditions, as well as establish transparency benchmarking. The example below shows haze for clarified PP at different ‘airgap’ distances.

If the material is intended to be used in contact for packaging applications and an upper limit of haze = 3% is required then the analysis determines the optimal clarifier content of 200 ppm.

In comparison, sphere-based hazemeter measurements provide an airgapidependent optimal value of 800 ppm. Hence, Rhopoint ID-L enables substantial cost savings by allowing to minimise the use of expensive additives.

Analysis of fluorescence impact on transparency Can be used in the case of whiteners and fluorophores employed as additives in, e.g. packaging and cosmetics industry sectors. The example below shows haze values measured with white and filtered light.

Here it is shown that the particular whitener used in the commercial clarifying agent contributes an appreciable fraction of ‘fluorescence haze’ to the total haze.

Hence, Rhopoint ID-L allows to optimise material formulations for application-specific lighting and viewing conditions.

Fluorescence haze vs total haze for PP samples with varying clarifier content.

Further details and examples can be found in the article in Macromolecular Materials & Engineering.

Features of the Rhopoint ID

Rhopoint ID Application Notes – Distance Related Haze

Rhopoint ID Application Notes – Distance Related Haze

Overview

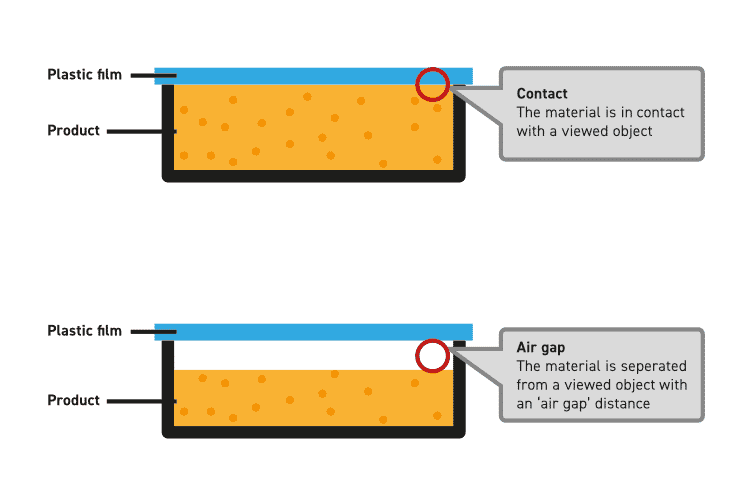
Optimising the optical properties of a packaging film for food applications is essential to ensure the food product underneath can be clearly seen. Many materials have transmission properties which vary dependent on whether the material is in contact with or at variable distance to a viewed object. As consumers are very selective concerning their choice and eventual selection of a packaged food any distortion or hazy effect in the packaging film will make the product less appealing having an effect as to whether the item is purchased.

So that the item can be viewed clearly and with good sharpness the film should have minimal haze at the viewing distance set by the packaging container.

To the right it can be observed that without a film covering the food in the left half of the packaging can be seen very clearly, whilst on the right the food with the film appears milky indicating that haze is present.

Measurement using traditional hazemeters according to the ASTM D1003 test method quantifies haze at a fixed distance, therefore any distance related haze effects cannot be detected or evaluated. Thanks to the imaging- based system of the Rhopoint ID, measurements can now be easily and accurately made to determine distance related haze properties of the film. To match any user specific application the Rhopoint ID can measure HID at any distance from 0-30mm allowing the peak obfuscation distance to be determined which is usually between 0.7 and 25mm.

Process

Example – BOPP Film

A customer supplied sample of BOPP film was
tested. A range of spacer mounts available as
optional accessories can be used allowing the
measured height of the film to be adjusted over
the range 0 – 30mm in steps of 2mm.
As some mounts are magnetised they
conveniently locate and hold the sample at each
measurement height.

STEP 1: The abraded sample was mounted onto the table and a measurement taken.

Contact with the graticule

STEP 2: Then 2mm spacers were placed underneath the film to sequentially increase the measurement distance.

Distance - 2mm

STEP 3 to 7: This process was repeated until there was no noticeable change in the measured haze value.

Results

Example – BOPP Film

Measurement Results

Observations of results

The measurement results provide valuable data to determine the haze variation and the maximum peak haze value of the film over a distance range. The addition of images allows visual comparison of each measurement due to the change in distance. Matching the material exactly to the application allows quality improvements and cost savings.

Features of the Rhopoint ID

Rhopoint ID Application Notes – PET Bottles

Rhopoint ID Application Notes – PET Bottles

Overview

Injection blow moulding, a high speed, large quantity production process, is used for the manufacture of plastic packaging bottles. In this process a polymer (typically PET) is injected into a blow mould to be inflated and cooled.

To ensure consistent quality of the finished product, the accurate control of operating parameters must be ensured. Should problems occur it is essential they are identified quickly to prevent wastage.

Typical problems can include:

  • Orange peel and texturing on external wall surfaces
  • Mould lines or marks
  • Contamination
  • Haze caused by surface roughness and bulk scatter

Using the Rhopoint ID it is possible to identify these problems in order to correct in process
failures.

Process

Example – PET Water Bottles

STEP 1: Three different customer supplied PET bottle samples were tested. Visually, they were all considered to be low haze with a “water white” appearance. Each bottle (A,B and C) was cut into 4 sections, labelled: Neck | Shoulder | Body | Base for measurement on the Rhopoint ID-L.

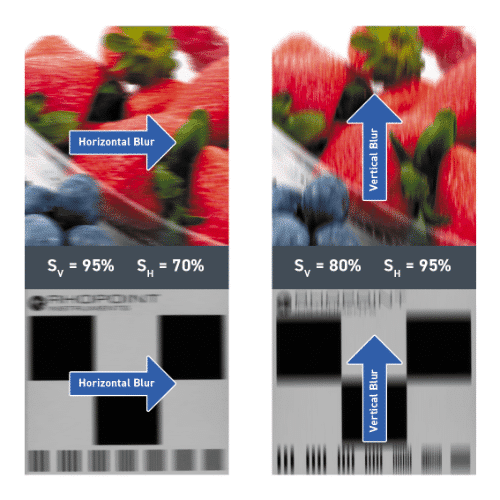
On closer inspection, the parts from bottle C were visually grainy, generally lower in sharpness and contained visible lines in the material that suggested anisotropy.

STEP 2: As the Rhopoint ID is vertically oriented, sample mounting was very easy, no adaptor or sample holding device was required. The cut samples were simply positioned onto the graticule and a measurement made.
Rhopoint ID

Results

Example – PET Water Bottles

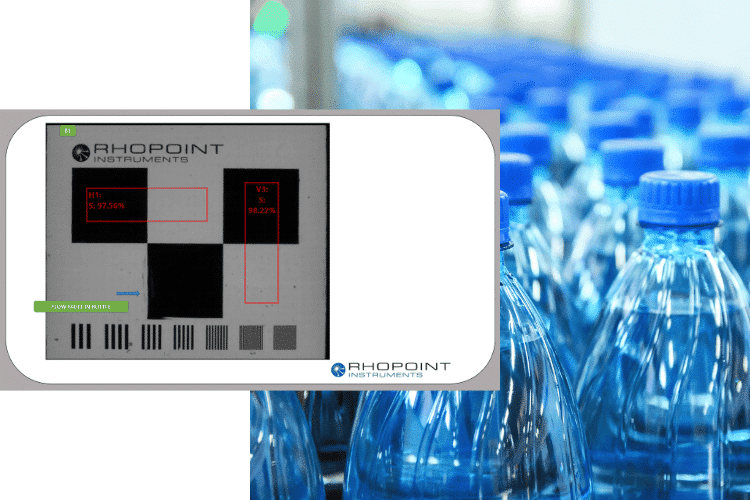
The images and data that follow was taken directly from the Rhopoint ID. Being a camera-based system it has the unique ability to provide detailed images of the measured sample that are very useful to verify problems in the quality of the material.

BOTTLE B – SHOULDER
H1: S: 97.56%
V3: S: 98.22%
BOTTLE C – SHOULDER
H1: S: 74.56%
V3: S: 93.70%

Measurement analysis Bottle B

Shoulder

BOTTLE B – SHOULDER
H1: S: 97.56%
V3: S: 98.22%

B-Shoulder – best quality

  • Low Haze – bottle is perceived as having a “water white”
    appearance.
  • High Sharpness – objects viewed through the material
    appear sharp and clear
  • Low Sharpness Anisotropy – there is no directional
    micro-texture visible in the material
Sample and Part Sharpness Anisotropy Sharpness Sharpness Horizontal Sharpness Vertical Visible Transmission Haze Haze Horizontal Haze Vertical
B - SHOULDER 2.2% 94.9 93.5 95.6 87.0 3.1 3.6 2.7

Measurement analysis Bottle C

Shoulder

BOTTLE C – SHOULDER
H1: S: 74.56%
V3: S: 93.70%

B-Shoulder – best quality

  • Low Haze – bottle is perceived as having a “water white”
    appearance.
  • Lower Sharpness – compared to other samples – on closer inspection a micro-texture was visible in the material.
  • Sharpness Anisotropy – higher than the other samples, a slight direction.
Sample and Part Sharpness Anisotropy Sharpness Sharpness Horizontal Sharpness Vertical Visible Transmission Haze Haze Horizontal Haze Vertical
C - SHOULDER 6.0% 87.3 84.5 89.9 86.5 3.3 3.8 2.8

Features of the Rhopoint ID

Rhopoint ID Application Notes – Surface Roughness & Bulk Scatter

Rhopoint ID Application Notes – Surface Roughness & Bulk Scatter

Overview

The visual quality (Haze and Sharpness) of a transparent plastic material can be impaired by surface roughness and/or internal optical irregularities.

Surface roughness is often imparted to the material during manufacture, similarly internal irregularities can be due to due to crystallization or caused by inhomogeneities (i.e. density difference, fillers, pigments) in the material bulk.

To improve processes or materials it is useful to identify exactly where the reduction in optical quality originates. The ID Surface roughness test can isolate and measure the effects of surface roughness on each side as well as the effects of bulk scatter in the material.

Cast Film Surface Roughness

The surface properties of a cast film can be affected by the condition of the chill roll used to cool the material after extrusion and the temperature control during the cooling process.

Process

The extrusion process

1 The extrusion process for making blown polyethylene film and bags starts with pushing the molten plastic through an annular slit die to form a continuous thin walled tube of plastic called a bubble.

2 The bubble is inflated with air to the desired diameter and drawn vertically up a tower through a high-speed air ring which cools it before passing through nip rolls where it is flattened to its lay-flat width.

3 The collapsed lay-flat tube is then transported back down the tower by external rollers. The thickness of the film is controlled by the speed at which it is pulled from the die. The width of the film is controlled by the amount of air that is inserted in the bubble. As blown film freely flows during the process surface roughness is mainly caused by the melt-flow characteristics and crystallization of the material during cooling.

4 It is therefore essential that in-process controls are optimised to ensure consistent product quality; the surfaces of the slit dies and chill rollers should be consistently free from wear or damage and the plastic melt homogeneity, blow-up ratio and cooling rate should be correctly controlled.

As film manufacture is a high-speed process it is critical that any quality problems are identified quickly to reduce wastage

Rhopoint ID method for isolating bulk and surface scatter

Process

Example – PMMA Film roughness

STEP 1: Three different samples of 0.25-mm-thick PMMA chemically etched film were used to simulate the effects of surface roughness. Each sample was tested using Rhopoint ID-L. The optional sample analysis plate accessory can be used to investigate the surface roughness and bulk scattering properties within the film.

STEP 2: The two-piece accessory allows plastic film samples to be trapped within two optically clear glass slides mounted in the unit.

Low viscosity oil is used to remove any surface roughness from each side of the film in turn to identify which side has surface roughness present.

One half of the analysis plate without sample is mounted onto the Rhopoint ID and the unit tared.

A small amount of oil is applied to the glass slide in the analysis plate and the film placed on top and moved to ensure no air bubbles are present underneath.

STEP 3: The analysis plate is placed into the Rhopoint ID measurement aperture and a measurement is taken.

Results

Example – PMMA Film roughness

With oil applied to both sides of the PRISTINE sample the haze value reduced slightly indicating that there was almost no surface roughness present. Transmission and Sharpness values were consistently high.
The Haze value for the GOOD film sample only was high and with oil applied to one side this dropped significantly indicating that surface roughness was present. When applied to the other side there was no change to the haze value. Sharpness and Transmission were consistently high.

The haze value for the POOR film sample only was very high and with oil applied to one side this dropped significantly indicating surface roughness was present on this side. Sharpness also increased. With oil applied to the other side the haze value dropped further indicating that there was a much smaller amount of surface roughness present.

As the etched film samples tested were produced from the same material there was no noticeable change in the Sharpness value of the oiled material measurements indicating a consistency in bulk properties.

Features of the Rhopoint ID

Why measure gloss?

Gloss is an aspect of the visual perception of objects that is as important as colour when considering the psychological impact of products on a consumer.

It has been defined as ‘The attribute of surfaces that causes them to have shiny or lustrous, metallic appearance.’

The gloss of a surface can be greatly influenced by a number of factors, for example the smoothness achieved during polishing, the amount and type of coating applied or the quality of the substrate.

Manufacturers design their products to have maximum appeal- highly reflective car body panels, gloss magazine covers or satin black designer furniture.

It is important therefore that gloss levels are achieved consistently on every product or across different batches of products.

Gloss can also be a measure of quality of a surface, for instance a drop in the gloss of a coated surface may indicate problems with its cure- leading to other failures such as poor adhesion or lack of protection for the coated surface.

It is for these reasons that many manufacturing industries monitor the gloss of their products, from cars, printing and furniture to food, pharmaceuticals and consumer electronics.

What is a glossmeter?

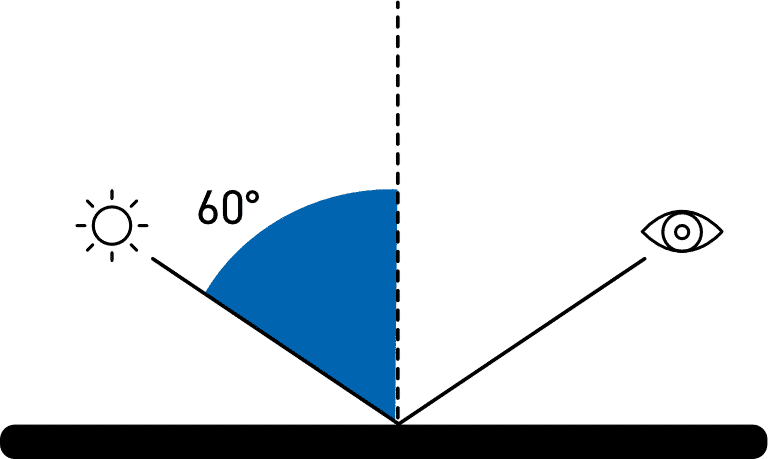
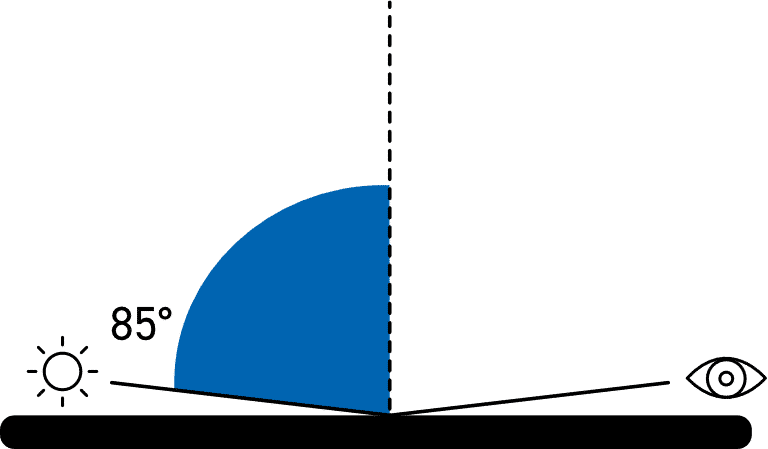
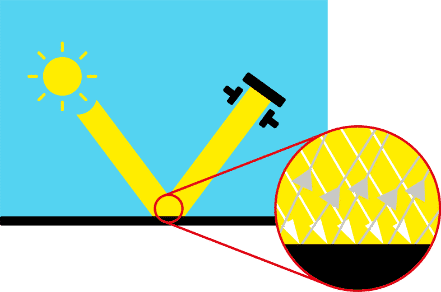
A glossmeter (also known as a gloss meter) is an instrument that is used to measure the specular reflection of a surface such as gloss. Gloss is determined by projecting a beam of light at a fixed intensity and angle onto a surface and measuring the amount of reflected light at an equal but opposite angle.

Novo-Gloss 60° Glossmeter

What glossmeter do I need?

Identify the surface that you wish to measure. Is it a flat surface? If so, it can be measured with a traditonal glossmeter.

Curved surfaces should be measured using equipment specifically designed for this type of application. Benchtop and handheld instruments are available for these applications.

Selecting the correct glossmeter is dependent on the application and level of gloss of the surface. Each gloss meter specifies the measuring angles utilised.

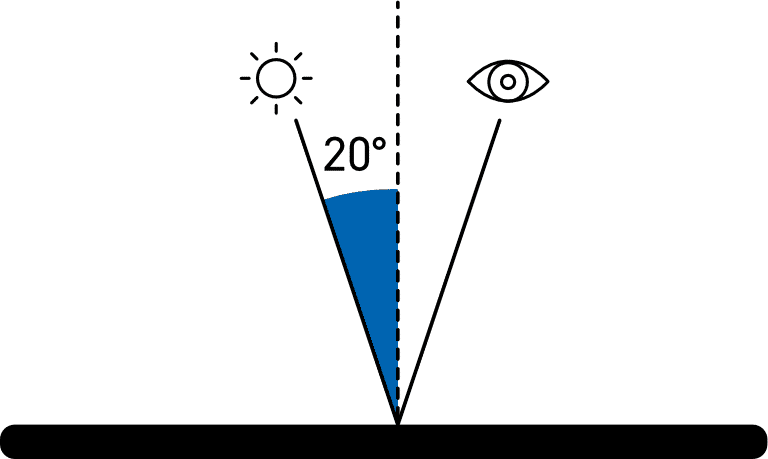
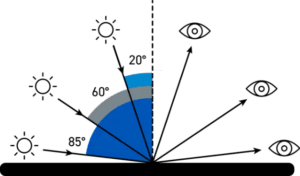
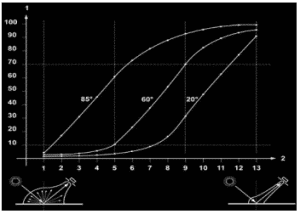
‘Measurement angle’ refers to the angle between the incident and reflected light. Three measurement angles (20°, 60°, and 85°) are specified to cover the majority of coatings applications. The angle is selected based on the anticipated gloss range, as shown in the following table.

Gloss Range 60° Value Notes
High Gloss >70 GU If measurement exceeds 70 GU at 60°, change test setup to 20°
Medium Gloss 10 – 70 GU
Low Gloss <10 GU If measurement is less than 10 GU, change test setup to 85°
20 degrees: 0-2000 GU (where 0 is matt and 2000 is a perfect mirror)
60 degrees: 0-1000 GU (where 0 is matt and 1000 is a perfect mirror)
85 degrees: 0-199 GU (where 0 is matt and 199 is a perfect mirror)
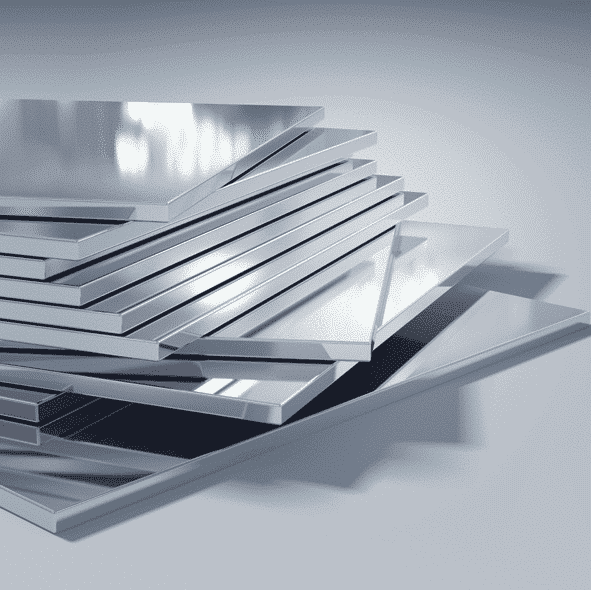
Examples of high gloss finishes include:
Glossmeter - car image
Glossmeter - polished metal
Glossmeter - polished concrete
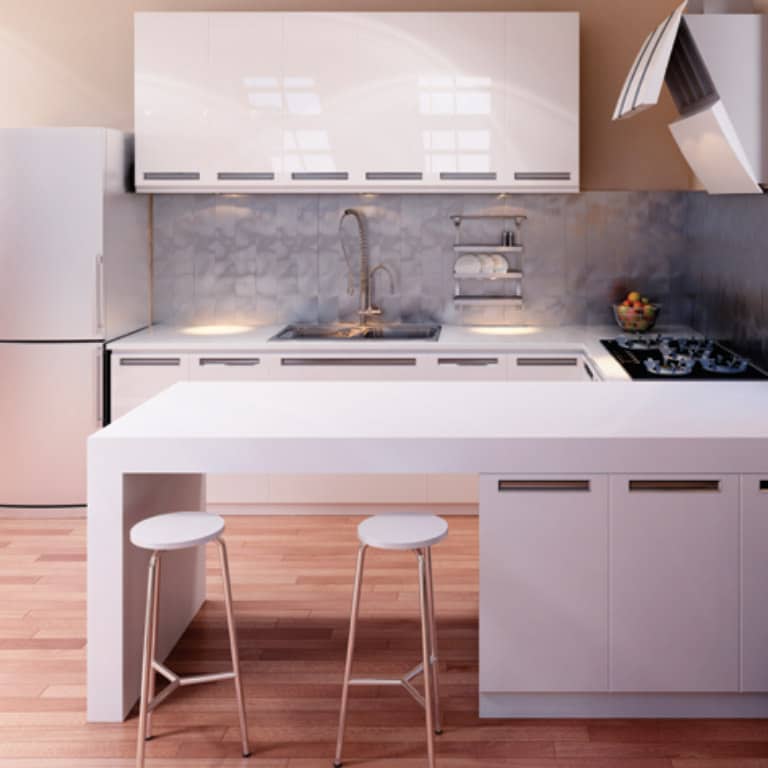
Examples of medium gloss finishes include:
Modern Kitchen
Examples of low gloss finishes include:
Seamless linen canvas with a low gloss measurement
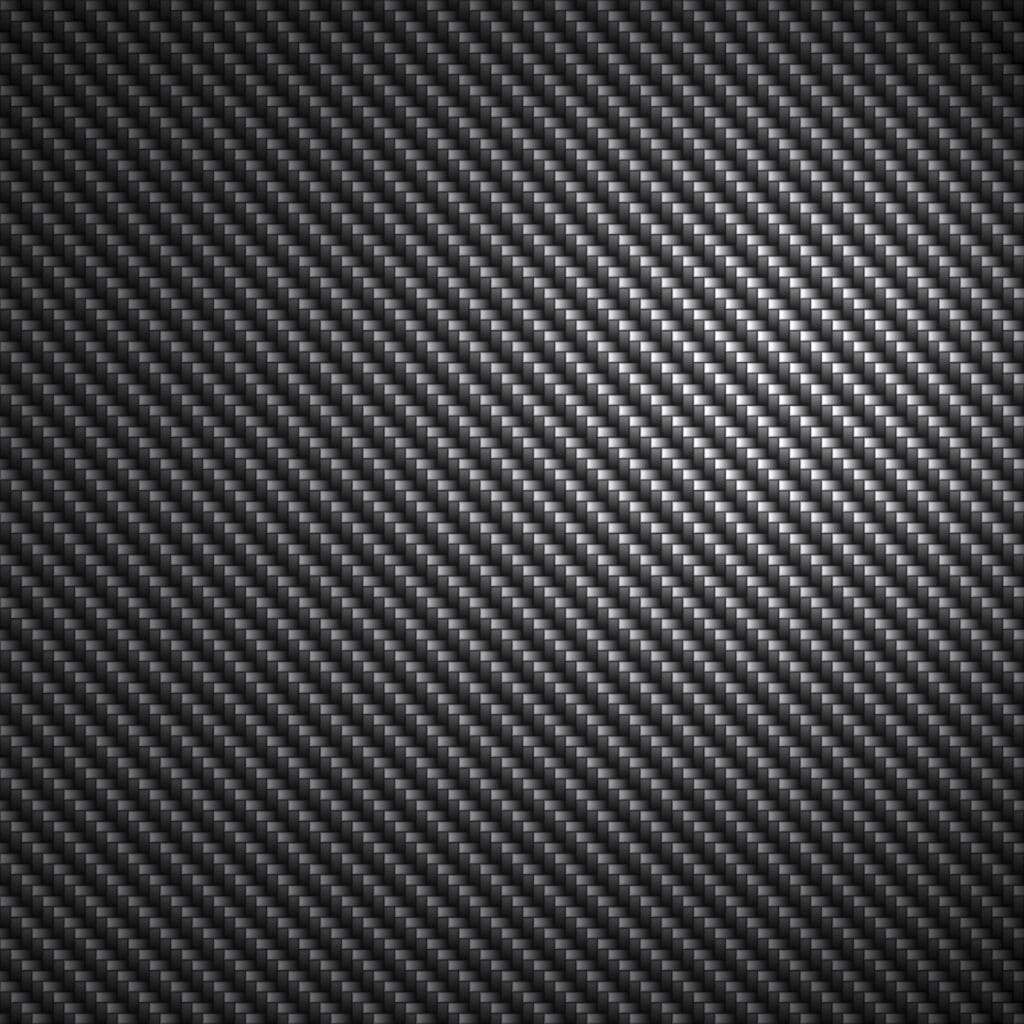
Glossmeter - carbon fibre
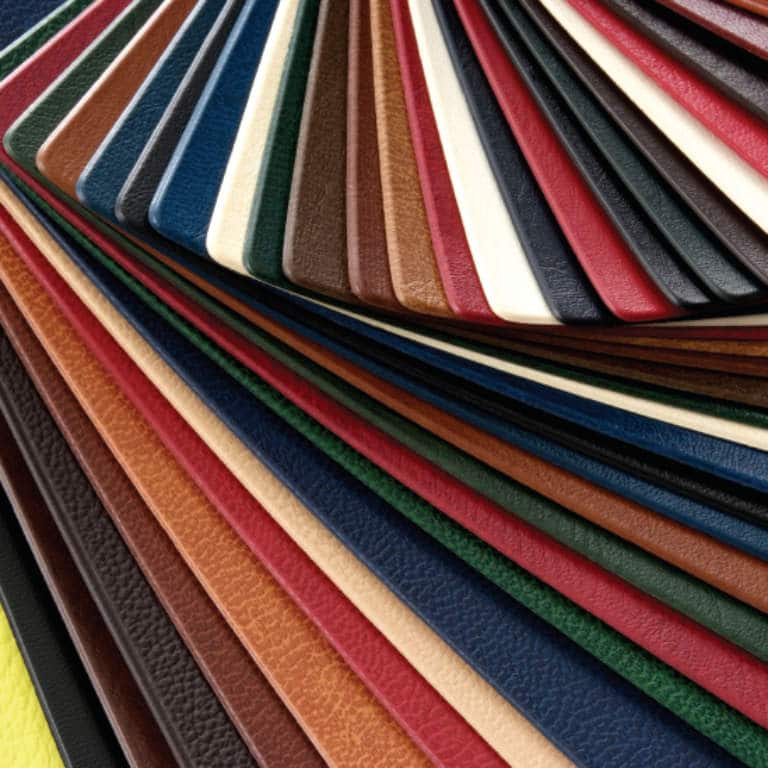
Leather is another example of a Low Gloss Finish

Selecting the correct angle for the application will optimise measurement accuracy.

Three types of instruments are available on the market: 60° single angle instruments, a combination of 20° and 60° and one type that combines 20°, 60° and 85°.

Two additional angles are used for other materials. An angle of 45° is specified for the measurement of ceramics, films, textiles and anodised aluminium, whilst 75° is specified for paper.

If a the appearance of a high gloss surface is affected by surface texture such as orange peel or a ‘milky’ finish or halos around reflections of bright light, these will need to be measured with the Rhopoint IQ

Novo Gloss Trigloss Glossmeter with Haze

  • 20/60/85° Gloss meter for matt to mirror finishes
  • Now features haze measurement to ASTM E430
  • Full statistical analysis with trend graphs

Novo Gloss Trio Glossmeter

  • 20/60/85° low cost glossmeter for all gloss applications
  • Rapid data transfer
  • Pass / Fail for easy identification of non conformances

Novo Gloss 60° Glossmeter

  • 60 degree glossmeter for all gloss applications
  • Easy reporting
  • Pass / Fail for easy identification of non conformances

How is gloss measured?

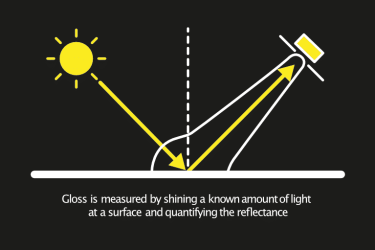
Gloss measurement diagram
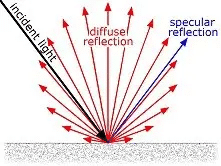
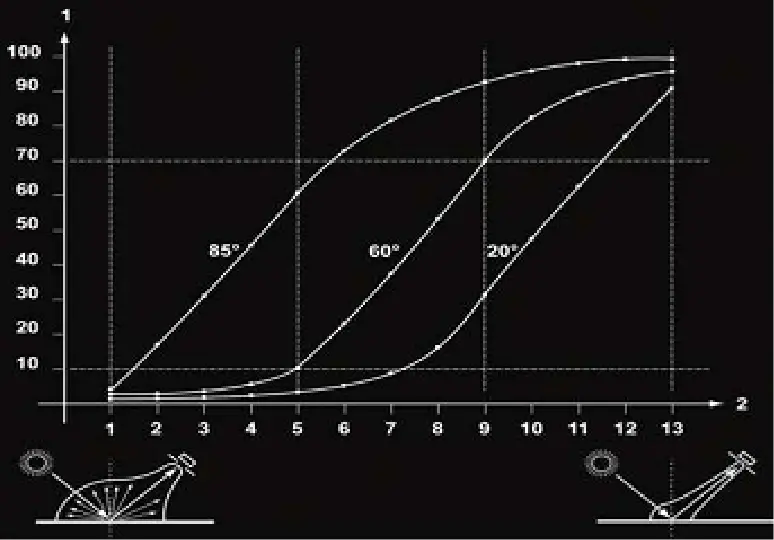
A glossmeter (also gloss meter) is an instrument which is used to measure the specular reflection (gloss) of a surface. Gloss is determined by projecting a beam of light at a fixed intensity and angle onto a surface and measuring the amount of reflected light at an equal but opposite angle. There are a number of different geometries available for gloss measurement each being dependant on the type of surface to be measured. For non-metals such as coatings and plastics the amount of reflected light increases with an increase in the angle of illumination as some of the light penetrates the surface material and is absorbed into it or diffusely scattered from it depending on its colour. Metals have a much higher reflection and are therefore less angularly dependant. Many international technical standards are available that define the method of use and specifications for different types of glossmeter used on various types of materials including paint, ceramics, paper, metals and plastics. Many industries use glossmeters in their quality control to measure the gloss of products to ensure consistency in their manufacturing processes. The automotive industry is a major user of the glossmeter with applications extending from the factory floor to the repair shop.  

How to measure Gloss

Animation explaining how to measure gloss

The construction of a Glossmeter

A typical glossmeter consists of a fixed mechanical assembly consisting of a standardised light source that projects a parallel beam of light onto the test surface to be measured and a filtered detector located to receive the rays reflected from the surface, Figure 1. The ASTM Method states that the illumination should be defined such that the source-detector combination is spectrally corrected to give the CIE luminous efficiency, V(l), with CIE illuminant SC. Diagram explaining how gloss is measured A number of instruments are commercially available that conform to the above standards in terms of their measurement geometry. The instruments are calibrated using reference standards that are usually made from highly polished, plane, black glass with a refractive index of 1.567 for the Sodium D line, and these are assigned a gloss value of 100 for each geometry.

Choosing the correct angle for gloss measurement

Measurement angle refers to the angle between the incident and reflected light. Three measurement angles (20°, 60°, and 85°) are specified to cover the majority of industrial coatings applications. The angle is selected based on the anticipated gloss range, as shown in the following table.
Gloss Range 60° Value Notes
High Gloss >70 GU If measurement exceeds 70 GU, change test setup to 20°
Medium Gloss 10 – 70 GU
Low Gloss <10 GU If measurement is less than 10 GU, change test setup to 85°
Diagram explaining Specular Reflection For example, if the measurement made at 60° is greater than 70 GU, the measurement angle should be changed to 20° to optimise measurement accuracy. Two types of instruments are available on the market: 60° single angle instruments, and one type that combines 20°, 60° and 85°. Two additional angles are used for other materials. An angle of 45° is specified for the measurement of ceramics, films, textiles and anodised aluminium, whilst 75° is specified for paper.

Understanding Gloss units

The measurement scale, Gloss Units (GU), of a glossmeter is a scaling based on a highly polished reference black glass standard with a defined refractive index having a specular reflectance of 100GU at the specified angle. This standard is used to establish an upper point calibration of 100 with the lower end point established at 0 on a perfectly matt surface. This scaling is suitable for most non-metallic coatings and materials (paints and plastics) as they generally fall within this range. For other materials, highly reflective in appearance (mirrors, plated / raw metal components), higher values can be achieved reaching 2000 Gloss Units. For transparent materials, these values can also be increased due to multiple reflections within the material.

Glossmeter Standards

Comparison of standards for gloss measurement
Standard 20° 60° 85° 45° 75°
High Gloss Medium Gloss Low Gloss Medium Gloss Low Gloss
Coatings, plastics and related materials Ceramics Paper
ASTM C346 X
ASTM D523 X X X
ASTM C584 X
ASTM D2457 X X X
BS3900 D5 X X X
DIN 67530 X X X
DIN EN ISO 2813 X X X
EN ISO 7668 X X X X
JI Z 8741 X X X X X
TAPPI T480 X

Glossmeter Calibration

Each glossmeter is setup by the manufacturer to be linear throughout its measuring range by calibrating this to a set of master calibration tiles traceable to NIST (National Institute of Standards and Technology). In order to maintain the performance and linearity of the glossmeter it is recommended to use a checking standard tile.  This standard tile has assigned gloss unit values for each angle of measurement which are also traceable to National Standards such as NIST.  The instrument is calibrated to this checking standard which is commonly referred to as a ‘calibration tile’ or ‘calibration standard’.  The interval of checking this calibration is dependent on the frequency of use and the operating conditions of the glossmeter. It has been seen that standard calibration tiles kept in optimum conditions can become contaminated and change by a few gloss units over a period of years. Standard tiles which are used in working conditions will require regular calibration or checking by the instrument manufacturer or glossmeter calibration specialist. A period of one year between standard tile re-calibration should be regarded as a minimum period. If a calibration standard becomes permanently scratched or damaged at any time it will require immediate recalibration or replacement as the glossmeter may give incorrect readings. International standards state that it is the tile that is the calibrated and traceable artefact  not the gloss-meter, however it is often recommended by manufacturers that the instrument is also checked to verify its operation on a frequency dependent on the operating conditions.

Advances in gloss measurement

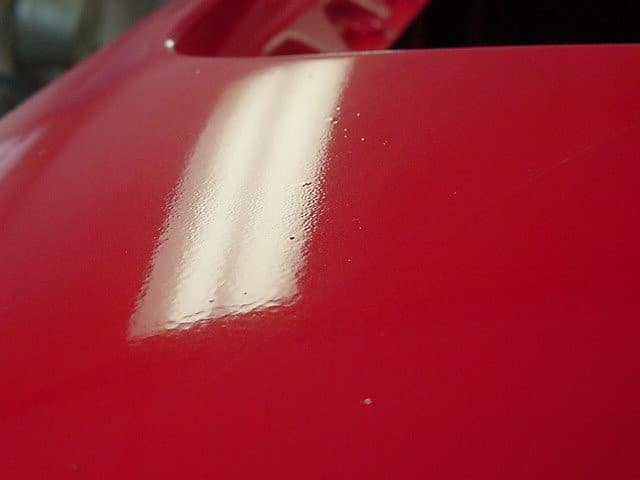
Car body panel with reflective light showing an example of orange peel and haze The glossmeter is a useful instrument for measuring the gloss of a surface.  However, it is not sensitive to other common effects which reduce appearance quality such as haze and orange peel. Haze: Caused by a microscopic surface structure which slightly changes the direction of a reflected light causing a bloom adjacent to the specular (gloss) angle. The surface has less reflective contrast and a shallow milky effect Orange Peel: An uneven surface formation caused by large surface structures distorting the reflected light Two high gloss surfaces can measure identically with a standard glossmeter but can be visually very different.  Instruments are available to quantify orange peel by measuring Distinctness of Image (DOI) or Reflected Image Quality (RIQ) and Haze.

Gloss meter Applications

The glossmeter is used in many industries from paper mills to automotive and are used by the producer and the user alike. Examples include:
  • Paints & coatings
  • Powder coatings
  • Additives
  • Inks
  • Plastics
  • Wood coatings, polishes and flooring
  • Yacht manufacture
  • Automotive manufacture and re-finis
  • Aerospace
  • Polished stone and metals
  • Consumer electronics
  • Anodised metals

Wood coatings, polishes and flooring

The gloss of hardwood flooring is typically measured at 60°. Wood flooring manufacturer’s finishing lines have been using gloss meters for many years to measure the gloss level in quality control (QC) to ensure they always achieve a consistent, quantifiable visual finish.
Gloss Reading Finish
Up to 20 GU Low Gloss
21-40 GU Medium Gloss
41 GU and up High Gloss
Wood flooring distributors want to check their stock to maintain the integrity of their stock allocation. When wholesale orders are filled from two or more different production runs a gloss meter can verify if the finish of that run is close enough to a preceding run to send out on a job site. Wood flooring dealers are always comparing the finish of their showroom samples to the actual product they receive from distributors and manufacturers. Gloss meters can help verify a major inconsistency that might impact negatively a project installation later. Wood flooring installation contractors who perform sand and finish operations on site (site-finishers) need to know the gloss level of the finish type they are using; water-based urethanes, oil-modified urethanes, deep penetrating oil, conversion varnishes, etc. Wood flooring inspectors get asked occasionally to verify gloss levels from two or more conflicting lots or runs to establish whether or not there was a problem with a previous order fulfillment. Mixing production runs does not always look good to a discriminating consumer with a sharp eye. This happens more often than people realise.

Choosing the correct range for gloss measurement

The Novo-Gloss, Rhopoint IQ and IQ Flex instruments have two ranges which can be selected in the measurement menu: black and mirror. The default option is called “auto”, where the glossmeter will automatically select the most suitable range for the measurement.  The black range has a maximum of 30% over the black tile calibration value – most of the time, this is ~130GU.

If measurements are regularly performed above ~120GU at any angle, it is strongly recommended to purchase the optional extra mirror calibration tile to ensure accuracy.

When both ranges have been calibrated on the correct tiles, the automatic range selection is generally reliable. There are, however, some surface types where one angle may be above the threshold and another below. This can cause the automatic range selection to fail, and the instrument may appear to be caught in a loop. (Note – this behaviour can also be caused by calibrating a range on the wrong tile.) In this situation, the correct range can be chosen manually in the measurement menu.

To decide which range to use, perform a measurement on the test surface. If the result at the required angle of measurement is over ~120GU, the mirror range should be used. If it is under, then the black range should be used.

If multiple angles are required and their results are above and below this threshold, then measurements using both ranges will be required.

How do I select the right angle to measure the gloss of my surface?

ISO 2813 and ASTM D523 (the most commonly used standards) describe three measurement angles for the measurement of gloss across surfaces of all levels.

The standard gloss unit (GU) is used, this is traceable to standards held at NIST.

Universal Measurement Angle- 60º

All gloss levels can be measured using the standard measurement angle of 60º. This is used as the reference angle with the complimentary angles of 85º and 20º often used for low and high gloss levels respectively.

Low Gloss- 85º

For improved resolution of low gloss a grazing angle of 85º is used to measure the surface. This angle is recommended for surfaces which measure less than 10 GU when measured at 60º.

This angle also has a larger measurement spot which will average out differences in the gloss of textured or slightly uneven surfaces.

High Gloss- 20º

The acute measurement angle of 20º gives improved resolution for high gloss surfaces. Surfaces that measure 70 GU and above at the standard angle of 60º are often measured with this geometry.

The 20º angle is more sensitive to haze effects that affect the appearance of a surface.

How can I measure the gloss of curved surfaces?

All standard gloss meters are designed for flat surfaces, if they are used on a curved surface, the measurement beam is reflected away from the instrument detector resulting incorrect readings. The more curved the surface the greater the error.

The solution to this problem is to using a very small area. The light is slightly scattered by the curved surface, however as long as the reflected beam remains sufficiently narrow to remain within the instrument detector the reading will be correct. The Novo-Curve gloss meter has been designed for this purpose and is specified for measuring cylinders and spheres with very low diameters. The Novo-Curve was developed in conjunction with the National Physics Laboratory (NPL).

How can I measure small surface areas?

The Novo-Curve gloss-meter has a very small measurement spot (2mm) that can be used to measure the gloss of very small parts or resolve differences in gloss across small areas.

To get equivalent readings to a standard gloss-meter on surfaces that are slightly irregular it is recommended that the average value is taken of several readings.

These instruments have been used to resolve the gloss differences across holograms, measure the polish on coins, steering wheels and extruded pipe work.

How can I measure irregular surfaces using the Novo-Curve?

When irregular or textured surfaces are measured, the small measurement area can give different gloss values compared to a standard meter that has larger measurement area. To produce comparable results, take 10 measurements on the Novo-Curve gloss meter and use the statistic function to calculate the average reading.

What gloss standard should I be using to measure gloss?

Many industries have adopted the 20/60/85º geometries as specified in ISO2813/ ASTM D523, however consult the table below for more information on specific industries and their industrial standards.

General Gloss measurement

ASTM D523 1999 (USA)

Test method for specular gloss

The principal ASTM specular gloss standard. Very similar to ISO 2813
ASTM D3928 1998 (USA)

Test method for evaluation of gloss or sheen uniformity

ASTM D4039 1999 (USA)

Test method for reflection haze of high-gloss surfaces

ASTM D4449 1999 (USA)

Test method for visual evaluation of gloss differences between surfaces of similar appearance

ASTM D5767 1999 (USA)

Test methods for instrumental measurement of distinctness of image gloss of coating surfaces

ASTM E430 1997 (USA)

Test methods for measurement of gloss of high-gloss surfaces by goniophotometry

MFT 30-064 (South Africa)

Local version of ASTM D523

JIS Z8741 1997 (JAPAN)

Method of measurement for Specular glossiness

Paint

IS0 2813 1994 (International)

Paints and varnishes – determination of specular gloss of non-metallic paint films at 20°, 60° and 85°

The principal ISO specular gloss standard. Very similar to ASTM D523

The following are technically similar to ISO 2813:

BS 3900: Part D5 1995 (UK)

Methods of test for paints – optical tests on paint films – measurement of specular gloss of non-metallic paint films at 20°, 60° and 85°

DIN 67530 1982 (Germany)

Reflectometer as a means for assessing the specular gloss of smooth painted and plastic surfaces

NFT 30-064 1999 (France)

Paints – measurement of specular gloss

at 20, 60 and 85°.

AS 1580 MTD 602.2 1996 (Australia)

Paints and related materials, methods of test – introduction and list of methods.

JIS Z8741 1997 (Japan)

Specular glossiness – Method of measurement.

SS 18 41 84 1982 (Sweden)

Paints and varnishes – measurement of specular gloss of non-metallic paint films at 20, 60 & 85°

Plastics

BS 2782: Pt 5, Method 520A 1992

Methods of testing plastics – optical and colour properties, weathering – determination of specular gloss

Similar to ISO 2813

ASTM D2457 1990

Test Method for Specular Gloss of Plastic Films and Solid Plastics

Specifies the primary standard as a perfect mirror with a defined gloss value of 1000. 20°, 60° and 45°; the 45° method is as ASTM C346 for ceramics.

Metals

BS6161: Part 12 1987

Methods of test for anodic oxidation coatings on aluminium and its alloys – measurement of specular reflectance and specular gloss at angles of 20°, 45°, 60° or 85°

Ref. Std BS 3900: Part D5 (1980); technically equivalent to ISO 7668 replaces BS 1615:1972. At 45°, dimensions of source image and receptor aperture are as for 60°. Squares with sides equal to the shorter sides of the rectangles are also recommended. Alternatively, total reflection in a 45° prism is used as a reference; source image and receptor aperture are then circular, both with angular diameter 3.44° ± 0.23° (1.5 mm ± 0.1 mm at 25.4 mm focal length)

IS0 7668 1986

Anodized aluminium and aluminium alloys – measurement of specular reflectance and specular gloss at angles of 20°, 45°, 60° or 85°.

IS0 5190

Anodizing of aluminium and its alloys – evaluation of uniformity of appearance of architectural anodic finishes – determination of diffuse reflectance and specular gloss

ECCA T2 (European Coil Coating Association)

Specular gloss at 60°.

Paper

DIN 54502 1992

Testing of paper and board; reflectometer as means for gloss Assessment of paper and board

ASTM D1223 1998

Test method for specular gloss of paper and paperboard at 75°.

Has unusual converging beam geometry. Specifies the primary standard as black glass of refractive index 1.540, not 1.567, at the sodium D-line having a defined gloss value of 100.

ASTM D1834 1995

Test method for 20° specular gloss of waxed paper

Another unusual converging beam geometry, different to the previous one.

TAPPI T480 OM-90 1990 (USA)

Specular gloss of paper and paperboard at 75°

Same text as ASTM D 1223

TAPPI 653 1990

Specular gloss of waxed paper and paperboard at 20°

Probably the same text as ASTM D 1834

JIS – Z8142 1993 (Japan)

Testing method for 75° specular gloss

Furniture

BS 3962: Part 1 1980

Methods of test for finishes for wooden furniture – assessment of low angle glare by measurement of specular gloss at 85°

Similar to ISO 2813: 1978

Floor Polish

ASTM D1455 1987

Test method for 60° specular gloss of emulsion floor polish

Ref. std ASTM D 523

Ceramics

ASTM C346 1987

Test method for 45° specular gloss of ceramic materials

Ref. std ASTM D 523

ASTM C584 1981

Test method for 60° specular gloss of glazed ceramic whitewares and related products

Ref. std ASTM D 523 {Sheen}

Fabrics

BS 3424: Method 31: Part 28 1993

Testing coated fabrics – determination of specular gloss

What is a gloss unit?

The measurement scale, Gloss Units (GU), of gloss meters is a scaling based on a highly polished reference black glass standard with a defined refractive index having a specular reflectance of 100GU at the specified angle.

This standard is used to establish an upper point calibration of 100 with the lower end point established at 0 on a perfectly matt surface. This scaling is suitable for most non-metallic coatings and materials (paints and plastics) as they generally fall within this range.

For other materials, highly reflective in appearance (mirrors, plated / raw metal components), higher values can be achieved reaching 2000 Gloss Units when measured at 20°.

What difference in gloss units is visible to the human eye?

If two different coatings are measured, what number of gloss units would be detectable by the human eye, how many units would be perceived as significantly different?

When measuring at 60 Degrees these detectable differences depend on the gloss level of the sample, for instance 3.0 GU difference measured on a very matt surface (perhaps 5GU), would be seen by the human eye but on a higher gloss coating (perhaps 60 GU) the difference would be very difficult to notice.

The only way that you can determine tolerances for your products would be experimentally, perhaps preparing printed samples at different gloss levels that you can show to end users of your coatings or internal “experts”

The other option is to change to a 20/60/85 degree instrument, the 85 degree glossmeter is more sensitive to differences in gloss below 10 GU @ 60º and the 20 Degrees has higher resolution on high gloss coatings (above 70 GU @ 60º). The advantage of using the three angles is that there is more equality to the gloss differences, in our experience a gloss difference of 5 GU, when measured with the correct geometry is just visible to a trained observer.

How to measure the gloss of transparent sheeted materials such as glass or glastic?

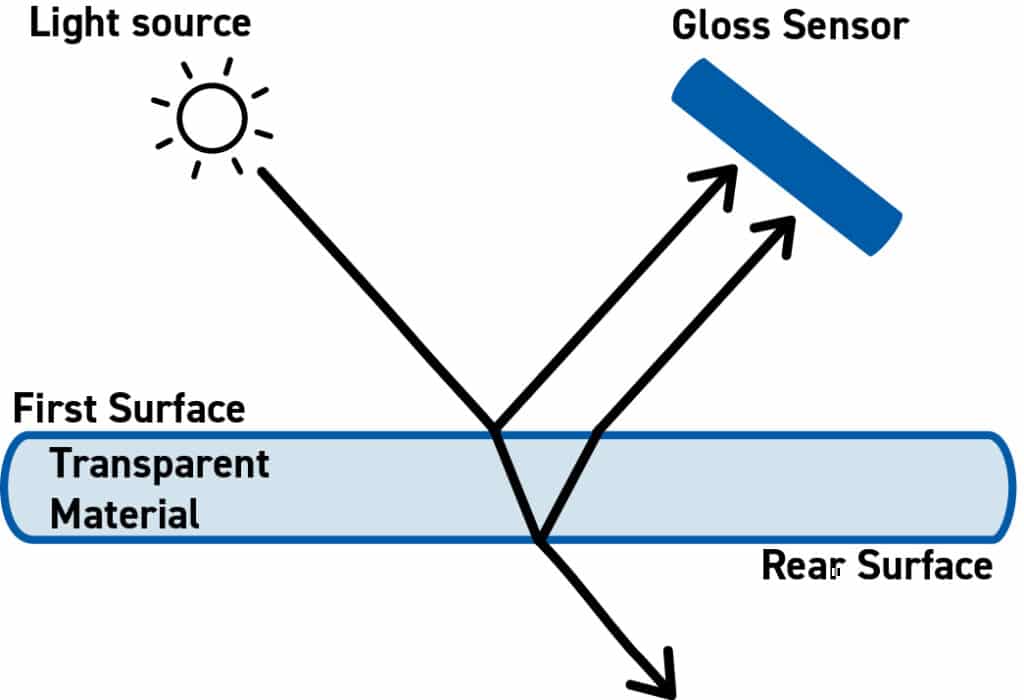
It can be problematic to measure the gloss of transparent sheeted material because light is reflected from both the front surface and internally from the second surface.

Figure 1: A transparent material will reflect from front and rear surfaces resulting in a higher gloss measurement than would be seen measuring the top surface alone.

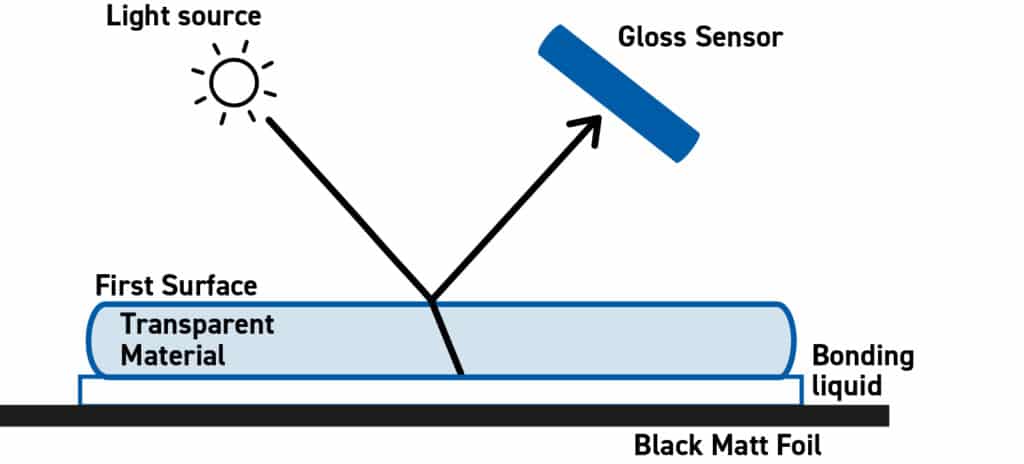
To only measure reflection from the front surface, the light passing into the material must be absorbed without reflecting from the second surface.

Figure 2: Transparent sample with black backing and an optically bonding liquid More info on: www.rhopointinstruments.com
Environmental setup to measure transparent materials with defined backing

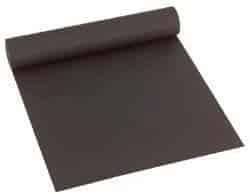
An inexpensive standard background to use would be matte black photography wrap that also works almost perfectly at absorbing any light passing through the material.

As any air between the transparent material and the foil will cause the second surface to reflect light, a liquid must be used to optically bond the transparent material to the black foil.

To completely eliminate second surface reflection a liquid with similar refractive index to the test material should be selected. In common practice a drop of water (readily available) or isopropanol (evaporates after measurement) are sufficient to get accurate gloss results for most transparent samples.

If you have any further questions, please feel free to contact us

Why should I send my glossmeter for manufacturer’s recalibration?

As well as calibrating your glossmeter on its own reference gloss tile before use, we recommend that the glossmeter and tile are calibrated yearly by a Rhopoint Approved Service Agent.  This ensures their accuracy, giving you full confidence that your product is performing correctly and that measurements are up-to-date with the best available reference data and compliant to current industry standards.

The primary master gloss artefacts used in our calibrations are calibrated by the National Institute of Standards and Technology (NIST), USA in accordance with the best practices and data available, which are upgraded when appropriate. All of our gloss calibrations are therefore traceable to NIST, with documentation available on request.

What does the calibration process involve?

When the instrument is received, we assess the physical condition and test its basic functions. We then survey the repeatability, accuracy and linearity of the instrument using a minimum of 8 gloss standards. If any major repairs are required, you will receive a quotation at this point before any work is undertaken.

Next, the optic elements and reference gloss tile are cleaned. The glossmeter is then calibrated at a minimum of 8 points throughout the full range of measurement for each angle, with minor adjustments made if required. The reference gloss tile is assigned new values from our master standards or replaced if it is damaged, and an updated certificate is produced.

The calibration date, internal stored calibration values, calibration reference and certification for your instrument are all updated. A report of the as-received readings is also supplied, so that any changes made during the calibration can be tracked and accounted for in a fully-traceable manner.

What is reflection haze?

A surface with a highly reflective finish can be seen to have a deep reflection and a high reflective contrast. However, one that exhibits a slight “milky” finish, observed as a milky halo or bloom from a reflection on the surface, is said to be suffering from Haze; the word Haze, therefore, is used to describe this effect.

Image showing deep reflection and high reflective contrast
Image showing shallow reflection and low reflective contrast

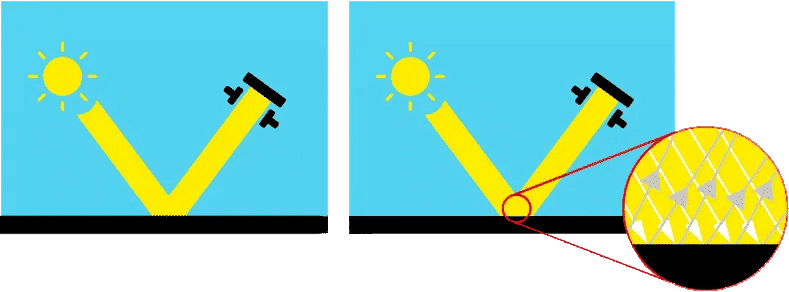
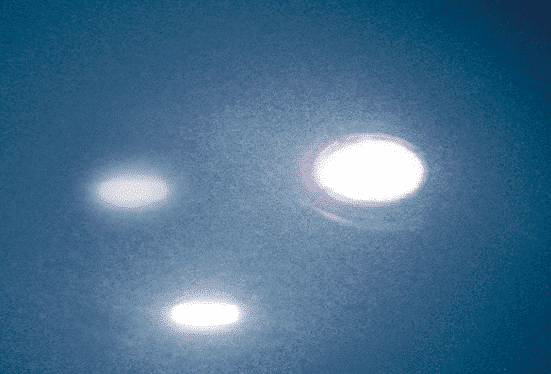
Haze is caused by microscopic surface textures that diffuse light adjacent to the main specular component of reflected light. When viewing the reflection of a strong light source in a surface with high haze the image “blooms” and has a bright halo around it.

Image showing reflection of strong light source in a surface with low haze
Image showing reflection of strong light source in a surface with high haze

Surface haze can be problematic in many coatings applications including automotive manufacture, powder coatings and other high gloss coatings. It can be attributed to a number of causes including incompatible materials in a formulation, poor dispersion and problems encountered during drying/curing/stoving. Haze is an important measure for highly polished metals and is often associated with polishing marks and machining direction.

How can I measure reflection haze?

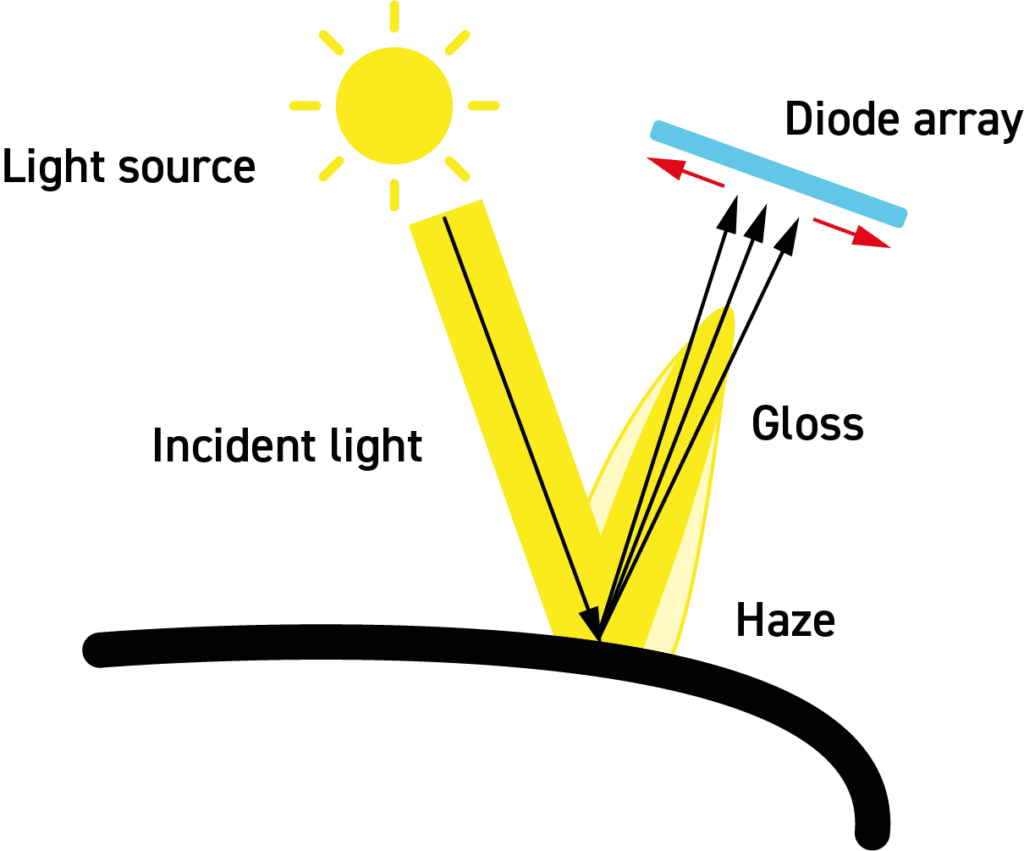
Reflection haze meters are traditionally used to measure reflection haze and use a standard glossmeter design with additional detectors 2º on either side of the specular angle to measure the haze component.

As the Rhopoint IQ incorporates an LDA, a 512 element, linear, photo-diode array (LDA) at the 20° angle instead of a single detector enabling measurement of the distribution of reflected light. haze measurement is easily accomplished using the reflected light data 2º on either side of the specular angle. The instrument can display the natural haze value (HU) or LogHaze value (HULOG).

Haze compensation is also required to correct variations when measuring different surface colours.

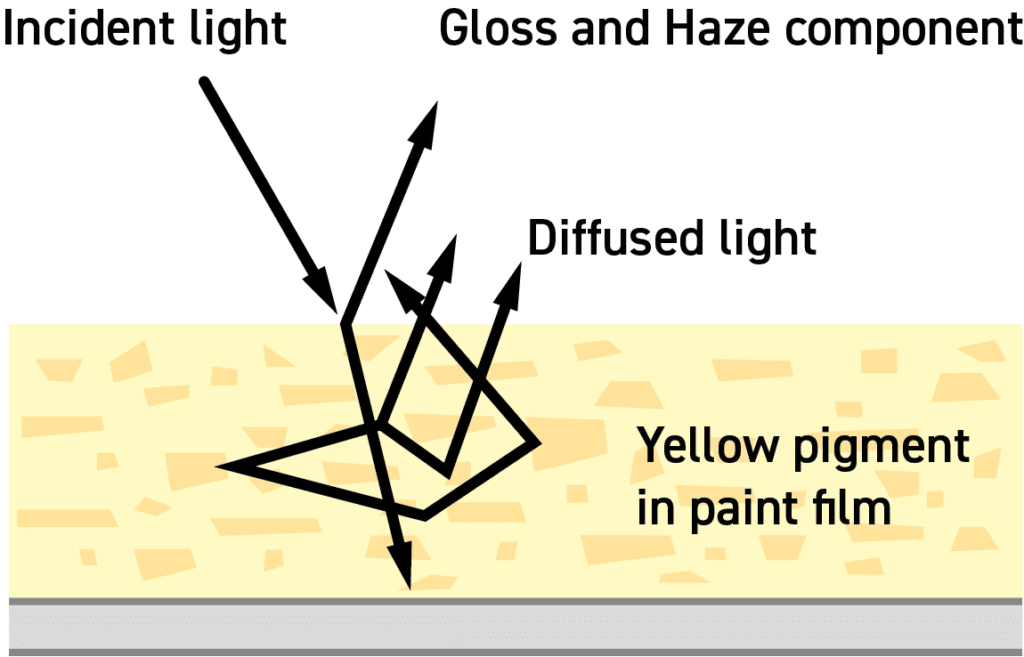
As reflection haze is caused by micro-textures on a surface, a small amount of light is reflected adjacent to the gloss angle. White surfaces, bright colours and metallics also produce a certain amount of diffuse light, reflected from within the material, to be present in this region. This diffuse light exaggerates the haze signal causing a higher than expected reading.

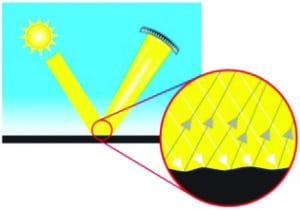
Diagram showing how micro-textures on a surface produces reflection haze

An advantage of the IQ is that, unlike a conventional instrument, compensation is calculated using a region adjacent to the haze angle. This technique gives compatible readings on solid colours but also compensates for directional reflection from metallic coatings and speciality pigments.

Diagram showing how the Rhopoint IQ can compensate for reflection haze utilising a diode array

What is orange peel?

When a person hears the term “orange peel” they instantly think of the outer skin of an orange and the textured appearance it has; to a coatings specialist however these words can mean a major headache in terms of how they are going to control the surface appearance of their coatings.

For many years in the coatings industry, orange peel has been used as a term to describe the visual sensation of texture on a painted surface. This texture is a combination of different structure sizes that can be caused by a number of different variable in the surface preparation and painting process.

In some industries such as the decorative paint industry, orange peel is desirable as it can create an attractive patterned surface for walls. However in the automotive industry, specific actions are taken to reduce the orange peel effect to a minimum in order to give a sharp, high contrast “quality” visual sensation, so that when the car in the showroom is viewed by a potential customer they get that “wow” feeling which eventually leads them to purchasing.

Factors that influence the levels of orange peel during manufacture can be classified into specific process areas. For example, during substrate material preparation, the use of incorrect abrasive materials can create fine structures on the material surface which can cause problems later down the line during paint application. Variations in the coating itself, i.e. coating thickness, viscosity and flow characteristics, particle size distribution and raw material quality can create larger structure sizes in the finished surface; also the orientation in which the coating is applied will cause more or less orange peel to be created, vertical application will always be greater than horizontal.

So from a coatings specialist point of view, the control of all these factors is critical in maintaining consistency of surface appearance quality of the finished product.

The Rhopoint IQ can detect changes in the orange peel of high gloss finishes. This instrument is used to measure orange peel in the paint industry.

How is orange peel measured?

Orange peel has typically been measured using a set of standardised test panels with varying degrees of orange peel as a visual comparison.

doi panels

This method, not only being time consuming and highly subjective is also not in any way accurate as there is no real data available to identify potential problem areas in the process. Instrumental methods of providing quantitative information have evolved enabling a greater understanding of Orange Peel and its causes resulting in the creation of a new metric, DOI (Distinctness Of Image) able to express the degree of orange peel present numerically. By measuring the clarity of reflected images the smoothness of a surface can be determined. The higher the degree of orange peel present, the less defined the reflections. The Rhopoint IQ measures the DOI of a surface by quantifying the way a reflected measurement beam is spread and distorted around the specular angle.

What is DOI? (Distinctness of Image)

DOI or Distinctness Of Image is, as the name implies a function of the sharpness of a reflected image from a surface.

Painted surfaces finished with similar coatings may produce identical gloss values when measured using a glossmeter however when visually assessed the quality of one surface against the other may be seen to be better than the other. Typically upon closer inspection the visually different surface will contain a degree of Orange Peel causing the reflection to become fuzzy and distorted.

doi panels

The images above demonstrate this measured versus visual difference, all surface measure identical gloss values however visually they appear different due to varying levels of Orange Peel present.

The DOI value of a surface is a number between zero and one hundred; a surface that reflects a perfect undistorted image returns a value of 100, as the value decreases the image quality deteriorates.

How is DOI (Distinctness of Image) measured?

DOI can be measured using a similar principle to gloss measurement by projecting light onto a surface at a particular angle. As orange peel is more noticeable on highly reflective surfaces a smaller measurement angle at 20° is preferred. The reflected light is collected at an angle equal but opposite to the normal specular angle using a wider angular band of measurement. This enables the amount of light deflected away from the specular angle to be determined.

Diagram showing DOI

The Rhopoint IQ is designed using the 20°/60°/85° geometry of a standard gloss meter but incorporates 512 element, linear, photo-diode array (LDA) at the 20° angle instead of a single detector enabling measurement of the distribution of reflected light. The spacing of the pixels of the LDA is such that it measures at the 20° ± 7.25° in steps of 0.02832°. The orientation of the source slit/aperture is set perpendicular to the plane of the incident and reflected beams to comply with the standard ISO 2813 – Determination of specular gloss, while the LDA is set in the plane of reflection.

The light source used in the instrument is a high power white LED filtered to correspond closely to the required spectral response, i.e. the photopic response function V(λ). The instrument calculates gloss values using the response from elements of the LDA which correspond to the angular tolerances in ISO 2813.

Why buy a Rhopoint IQ, not a gloss meter?

The Rhopoint IQ combines four appearance measuring instruments into one gloss meter size unit.
In a single button push the instrument measures:

Gloss (20/60º or 20/60/85º)
Reflected Image Quality (RIQ)
Haze
Distinctness of Image (DOI)

Why is it not enough to measure only gloss?

For many years a standard gloss meter has been specified and used as a Q.A. tool for quantifying and validating surface appearance quality. It is based on a long established measurement principle, this compares the amount of light transmitted onto a surface with the amount reflected from it at a fixed measurement angle.  This produces a value of gloss unique to that surface. This gloss value, however, can often be misleading as it does not define other surface appearance effects that can be seen visually.

doi panels

The ten panels above demonstrate this visual difference.

When measured using a standard gloss meter, each of the panels produces the same gloss value however to the eye they appear different.

This visual versus measured discrepancy is due to the texture being present on the surface caused by large (orange peel) and microscopic structures (haze).

Due to the limitations in measurement technology a gloss meter is, therefore, unable to detect these structures as it can only determine gloss values hence why visually the surfaces appear substandard.
What is gloss and how is it measured?

Angles of Gloss Measurement Reflectance values for low gloss matt surfaces are too low to be able to determine any differences when observed visually – so predominantly gloss is of importance. However, as the reflectance value increases towards high gloss the effects of surface texture become more significant, therefore, as defined above, for these surfaces the use of the 20-degree angle is preferred for greater accuracy and resolution. Gloss is the visual sensation associated with the perceived brightness of direct light reflected from a surface. Surfaces with high reflectance are determined as glossy; less reflective surfaces are semi-gloss or matt. Gloss meters quantify this effect by measuring the specular light reflection from a surface at an equal but opposite angle of illumination at defined angles. Gloss Unit The Gloss Unit (GU) is defined in international standards including ISO 2813 and ASTM D523. It is determined by the amount of reflected light from a glass standard of known refractive index. The measurement angles most commonly used for gloss are 20°, 60° and 85°. The most appropriate angle should be selected dependent on the glossiness of the sample surface. Using the correct measurement geometry increases resolution and improves the correlation of results with human perception of quality. How to determine the best angle To determine the correct measurement angle the surface should be assessed with the 60° geometry- Matt surfaces which measure below 10 GU @ 60°should be re-measured with the 85° angle. High gloss surfaces which measure above 70 GU @ 60° should be assessed using the 20° angle. The 60 degree angle is best suited to mid gloss measurement of samples between 10-70 GU. Selecting The Correct Angle of Measurement with a Glossmeter Law of Reflection Law of Reflection in Gloss Law of reflection is the direction of incoming light and the direction of outgoing light reflected make the same angle with respect to the surface. The standard method for measuring gloss using a gloss meter at 20° requires an acceptance angle of ± 0.9° around the specular angle of 20°. This narrow angular measurement range of reflected light does not allow the sensor in a gloss meter to detect the texture on a surface as the structures within the texture cause the reflected light to be deflected at a greater angle. Measuring Gloss with the Rhopoint IQ The Rhopoint IQ is different to a gloss meter as it uses a linear diode array (LDA) at 20° to measure the distribution of reflected light between 12.75° – 27.25°. Conventional glossmeter optics are used at 60° & 85° and these fully comply with international gloss standards such as ISO 2813 and ASTM 523. The instrument does not have physical receiver apertures like a conventional gloss meter; the 20° gloss value is obtained by measuring with the elements of the linear array that correspond to the angles specified in the standards. This feature allows the instrument to quantify the effects of texture on a surface that can be classified as either orange peel or haze according to their size.

Reflectance values for low gloss matt surfaces are too low to be able to determine any differences when observed visually – so predominantly gloss is of importance.

However, as the reflectance value increases towards high gloss the effects of surface texture become more significant, therefore, as defined above, for these surfaces the use of the 20-degree angle is preferred for greater accuracy and resolution.

Gloss is the visual sensation associated with the perceived brightness of direct light reflected from a surface. Surfaces with high reflectance are determined as glossy; less reflective surfaces are semi-gloss or matt.

Gloss meters quantify this effect by measuring the specular light reflection from a surface at an equal but opposite angle of illumination at defined angles.

Gloss Unit

The Gloss Unit (GU) is defined in international standards including ISO 2813 and ASTM D523. It is determined by the amount of reflected light from a glass standard of known refractive index.

The measurement angles most commonly used for gloss are 20°, 60° and 85°.

The most appropriate angle should be selected dependent on the glossiness of the sample surface.

Using the correct measurement geometry increases resolution and improves the correlation of results with human perception of quality.

How to determine the best angle

To determine the correct measurement angle the surface should be assessed with the 60° geometry-

  • Matt surfaces which measure below 10 GU @ 60°should be re-measured with the 85° angle.
  • High gloss surfaces which measure above 70 GU @ 60° should be assessed using the 20° angle.
  • The 60 degree angle is best suited to mid gloss measurement of samples between 10-70 GU.
best angles for measuring gloss

Law of Reflection

Law of reflection diagram

Law of reflection is the direction of incoming light and the direction of outgoing light reflected make the same angle with respect to the surface.

The standard method for measuring gloss using a gloss meter at 20° requires an acceptance angle of ± 0.9° around the specular angle of 20°.

This narrow angular measurement range of reflected light does not allow the sensor in a gloss meter to detect the texture on a surface as the structures within the texture cause the reflected light to be deflected at a greater angle.

Measuring Gloss with the Rhopoint IQ

The Rhopoint IQ is different to a gloss meter as it uses a linear diode array (LDA) at 20° to measure the distribution of reflected light between 12.75° – 27.25°.

Conventional glossmeter optics are used at 60° & 85° and these fully comply with international gloss standards such as ISO 2813 and ASTM 523.

The instrument does not have physical receiver apertures like a conventional gloss meter; the 20° gloss value is obtained by measuring with the elements of the linear array that correspond to the angles specified in the standards.

This feature allows the instrument to quantify the effects of texture on a surface that can be classified as either orange peel or haze according to their size.

What is haze and how is it measured?

What is haze?

Haze is light that has been reflected by very small surface structures adjacent to the main specular angle. The term “Haze” defines the milky halo or bloom observed visually on high gloss surfaces.

Surface haze

Surface haze can be problematic in most coating applications including automotive manufacture, powder coatings and other high gloss coatings. It can be attributed to a number of causes including incompatible materials in a formulation, poor dispersion and problems encountered during drying/curing/stoving.

Coatings without haze can be seen to have a deep reflection and have high reflective contrast. Those with haze exhibit a slight “milky” finish which can be seen over the highly glossy surface.

Haze is caused by microscopic surface texture which diffuses light adjacent to the main component of the reflected light.

Image showing deep reflection and high reflective contrast
Image showing shallow reflection and low reflective contrast

When viewing the reflection of a strong light source in a surface with high haze, the image “blooms” and has a bright halo around it.

Image showing reflection of strong light source in a surface with low haze
Image showing reflection of strong light source in a surface with high haze

Haze is an important measure for highly polished metals and is often associated with polishing marks and machining direction.

Measuring Haze with the Rhopoint IQ

Using the LDA technology in the Rhopoint IQ, measurement of Haze is easily achieved, using the procedure described in ASTM E430, by analysing the amount of light that has been deflected +/-2° either side of the specular angle.

Haze compensation is also included to allow haze measurement on different coloured surfaces, the light diffusion caused by bright colours e.g. white, yellow would otherwise produce higher levels of haze even though they are the same.

This measurement is performed automatically by the instrument in one process.

What is orange peel and DOI and how is it measured?

What is DOI?

Distinctness of Image is, as the name implies a function of the sharpness of a reflected image in a coating surface.

Two surfaces finished with similar coatings may exhibit identical gloss values but visually the quality of one coating can be seen to be very poor. Upon closer inspection the visually substandard poor coating has a highly textured dimpled appearance known as “orange peel”. When a reflected object is viewed in such a coating the image becomes fuzzy and distorted.
What is orange peel?

Orange peel, waviness, texturing, pin holing and similar effects can be problematic in many high gloss coating applications including automotive, powder coating and any other industries that requires a smooth homogenous finish. All these effects can be measured with the Rhopoint IQ.
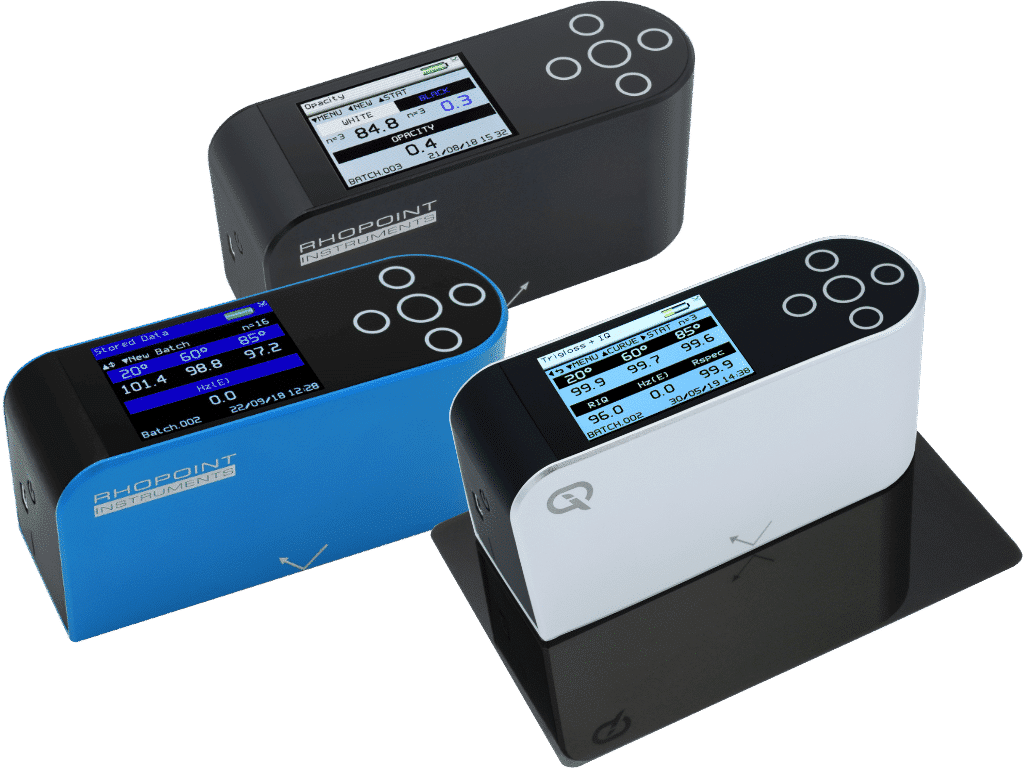
DOI has been measured instrumentally and subjectively in the automotive industry for many years. Instruments that measured this value in the past were bulky expensive and some had poor repeatability. DOI measurement was not common outside of automotive because of the cost of equipment was high and the demand for high quality gloss finish was not as crucial.

Diagram showing DOI

Measuring Orange Peel and Distinctness of Image (DOI) with the Rhopoint IQ

The Rhopoint IQ measures the DOI of a surface by quantifying the way a reflected measurement beam is spread and distorted around the specular angle.

Example test panels with low and high DOI values. Orange peel, texture, flow out and other key parameters can be assessed in coating applications where high gloss quality is becoming increasingly important.

The DOI value of a surface is a number between zero and one hundred; a surface that exhibits a perfect undistorted image returns a value of 100, as texture increases the image becomes distorted and the DOI value decreases.

Disadvantages of Distinctness of Image

Distinctness of Image (DOI) was one of the first parameters to define surface texture, it was originally a visual and instrumental measurement.

Distinctness of image is, as the name implies a function of the sharpness of a reflected image in a coating surface. As more orange peel becomes visible on a surface the distinctness of the reflected image becomes lower.

This effect is measured instrumentally by quantifying the way that light is reflected around the specular angle, a perfectly smooth surface with sharp reflection has a DOI of 100, decreasing with the amount of orange peel present.

Whilst the DOI parameter was suitable for the fineness of finish available around the time of its development, the quality of today’s coatings has increased to a point where DOI is a much less relevant measurement in many industries.

What is Reflected Image Quality (RIQ)?

Reflected Image Quality is a new measurement developed by Rhopoint Instruments to provide greater sensitivity when evaluating highly reflective coatings and the specular / diffuse element of lower gloss materials.

Two highly reflective surfaces that have very small changes in orange peel or texture will show very little or no change in DOI due to the way that it is calculated, but will appear quite different visually.

By reducing the sensing distance around the specular angle and measuring the reflected light and distortion around it, a much higher resolution response is achieved with greater linearity, more in line with the visual experience.

Reflective Panels

Two highly reflective panels with the same gloss values show little change in DOI but appear different. However, when using RIQ a greater differentiation is achieved.
ACT Panels Graph
Average measurements of ACT Panels 5 – 10 show little variation when using DOI.
The RIQ value of a surface is also a number between zero and one hundred; a surface that exhibits a perfect undistorted image returns a value of 100, as the values decrease higher surface texture is present and the image sharpness reduced.

ACT panels linegraph

Why use RIQ instead of DOI?

DOI is not sensitive to low amounts of orange peel on the highest quality surfaces.

RIQ has more proportionate response to orange peel on a wider range of surface finishes.

RIQ works well in differentiating low gloss surfaces with different specular/diffuse components.

RIQ measurement is sensitive enough to quantify appearance differences due to-

  • Substrate alignment (horizontal/vertical)
  • Coating formulation
  • Substrate
  • Application technique

Gloss, Haze, DOI and RIQ values are all produced simultaneously in one fast measurement using the Rhopoint IQ.

In addition to this…Surface flatness also affects the reliability of measurements made with a glossmeter. Rhopoint IQ however incorporates Flatness compensation.

Sample Flatness Compensation and Measuring Reflected Image Quality (RIQ) with the Rhopoint IQ

Sample Flatness Compensation

20° gloss & haze meters have fixed geometry. They require very flat surfaces to measure accurately.

The Rhopoint IQ uses a 512 element sensor that measures 20 +/- 7.25°. It mathematically determines the gloss angle.

With a standard gloss meter non-flat surfaces cause light to reflect on an incorrect part of the sensor and give inaccurate gloss results. With the Rhopoint IQ light is reflected on different areas of the diode array, and the instrument automatically compensates for the surface irregularities.

On the left: Two similar appearance surfaces, one is curved- the reflected light falls away from the centre of the array.

The reading on the right showing the IQ automatically compensating for non-flatness.

Law of Reflection: The direction of incoming light and the direction of outgoing light reflected make the same angle with respect to the surface.

What is RSpec?

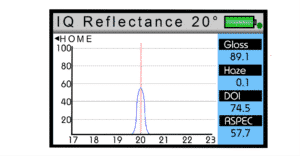
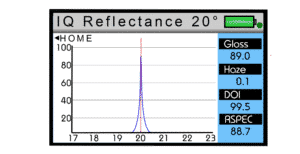
RSpec is the peak reflectance measured over a very narrow angular band in the specular direction (+/-) 0.0991º.

RSpec is very sensitive to any texture that is present on a surface. This texture or waviness acts as a concave or convex reflector that deflects light around the specular angle. When RSpec is equal to the gloss value the surface is smooth, as texture increases the RSpec value decreases.

The diagram above shows the same coating applied to two panels, the first has orange peel/waviness present due to the incorrect application setting on the spray gun.

Measuring Shade and Opacity

Tape/reflectivity test:

The Novo-Shade Duo + uses reflectance to grade a surface colour from pure white (100% Reflectance) to Black (0% Reflectance). This simple colour grading is effective in measuring the cleanliness of steel.

Equipment

Clear “Scotch” or 3M tape.

Rhopoint Instruments Novo-Shade Duo 0/45° Reflectometer operating in “Shade Mode”

Test procedure

Stick a piece of clean uncontaminated tape onto a sheet of white copier type paper. This is the 100% reflectance sample (A).

Stick a new piece of uncontaminated tape (B) onto the metal surface to be tested, press and smooth the tape so any contaminates are stuck to it. Carefully peel the tape from the surface and transfer it, sticking it to the same piece of paper with 100% reflectance sample.

Measurement

Calibrate the Novo-Shade Duo + on the clean white tape (A)

The average reflectance value of several readings should be taken across the contaminated area on tape (B). A minimum of five is recommended; use the statistical analysis function to ascertain this value. The average value indicates cleanliness; a clean surface will exhibit higher reflectance.

Can the Novo-Shade Duo replace a cryptometer?

The Novo-Shade Duo +  does a better job than this, however, it can only be used to measure dried/cured films.

Dry film hiding power is more important than wet film hiding power – the paint may cover the surface when wet but could exhibit show-through when cured.

Method

The customer draws down the paint on an opacity chart using a standard draw down method. It is sensible to draw down a master vs batch.

The customer allows the paint to cure and uses the instrument in opacity mode- measuring 3 times on white and then 3 times on the black portions of the chart.

Hiding power is automatically calculated. The hiding power of the master and batch are compared.

Advantages

This is an objective measurement- a % hiding power is given (not a subjective judgement).

It can be used for all coatings and draw down methods- as long as they can be done on an opacity chart- print proofing, draw down, K-bar, brush out etc.

The hiding power of inks printed onto transparent media can be measured by placing the printed material over black and white tiles.

Any colour paint/coating can be measured.

The cured drawdown can be filed as QA evidence.

Wet film hiding power and Dry film hiding power are not equivalent and the latter is most important to the customer!

Some high/low viscosity paints/coatings can not be measured on the cryptometer.

How often should I calibrate the instrument?

The instrument should be calibrated before use. It should also be calibrated if there is a change in conditions (temperature, humidity, etc.) Generally, the calibration should be checked by taking a reading on the supplied standard at least every half-hour during continuous use.

Can I use my instrument when it is one year past the last certified date?

You can dismiss the warning that appears by pressing the centre button, and the instrument will function as normal. This message depends on the calibration date programmed into the instrument, which will match the calibration date declared on the certificate. The calibration is valid to 1 year from the date of calibration, or from the date of first use (if this has been filled in). After this, the instrument can be used for comparative use only. It cannot be used as part of a traceable process.

How do I clean my calibration tile?

To remove dust, there is a cleaning cloth supplied. Take care to touch only one side of it and use the other side to clean the tile. This will help stop finger grease from building up over time. If a replacement cloth is required, you can contact an accredited service centre, or use a fresh cleaning cloth suitable for glasses.

If you suspect there is a greasy residue on the tile, breathe on it. Any grease will show up as a slight rainbow sheen. This can usually be removed with a fresh cleaning cloth. Iso-Propyl Alcohol can be used to remove larger amounts of grease. Ensure that the IPA is removed from the tile with a lint-free cloth while still wet. Allow the tile up to an hour to settle before use.

If available, dry, clean air from a compressor can be used to remove dust.

How do I know when my calibration tile needs replacing?

The calibration tile will need replacing if the read area on the tile is damaged.

Image of the Rhopoint IQ showing the read area, indicated by the markings
Read area is indicated by markings on the instrument

If in any doubt, please contact our service department who will be able to assist you in determining if a replacement is required.

Do I need to send my instrument and tile for calibration or just tile?

You will need to send both for a full calibration. The gloss meter must be used with a certified standard for traceable results. It has its linearity tested against NIST standards. The tile has a value assigned. When the instrument is calibrated on the provided tile, the results are traceable to our NIST certification in accordance with BS EN ISO 2813, which is the main standard for the measurement of gloss.

We do have a tile-only calibration option however, we would recommend that this is used only for additional tiles.

My instrument won’t switch on

The first thing to check is the battery. Connect the instrument to a power source via the USB cable. A computer, or the supplied mains>USB converter will both work. Leave the instrument for 30s, and then try to power up again.

If the instrument beeps but the screen does not turn on, this indicates that there is an issue with the screen. This will require repair at a Rhopoint accredited service centre.

If the LED lights at the base of the instrument turn on when the power button is held, then the instrument is in programming mode. This will require repair at an accredited service centre.

I get an error message when I calibrate my instrument

There are three possible error messages that may result from a failed calibration.

“Warning! Possible calibration error”

This message appears when the results of a calibration do not match the stored one. If you have calibrated your instrument on a different tile from the normal one (such as a mid-gloss tile) you can safely ignore this message.

Check that the instrument is correctly seated on the calibration tile and that the protective white tissue supplied with the instrument has been removed.

Check the tile and optics for contaminants. A residue-less solvent such as Iso-Propyl Alcohol can be used to clean these surfaces.

“Warning! Possible contamination”

This message appears on instruments that have a haze measurement function when the haze is higher than expected. If you are calibrating on a low-gloss tile, this message can be safely ignored. If this is done regularly, “Haze Tolerance” in the calibration menu can be set higher.

Check the instrument is correctly seated on the calibration tile, and the white tissue supplied with the instrument has been removed.

Check the tile and optics for contaminants. A residue-less solvent such as Iso-Propyl Alcohol can be used to clean these surfaces.

“Calibration Reference not set”

This means that the stored calibration has been lost or corrupted. The only function of the instrument that it will affect is calibration error detection. This message can be dismissed and the instrument used as normal. This issue will be resolved as part of a standard annual recalibration with an accredited service centre.

My instrument readings vary too much

The first thing to remember is that each gloss measurement angles has different sensitivities at different gloss values. The 60° angle is used for general-purpose measurements. The 20° angle is most sensitive at high gloss values, and the 85° angle is sensitive at low gloss values.

Graph showing how the different angles have varying sensitivities

The next thing to consider is the physical stability of the instrument. Even a small rocking motion can produce large variations in the gloss reading.

The finish quality of the surface can have a large impact. Uneven colours or textures will add a random variation to the gloss measurements. The best way around this is to take several samples and average the results. The more variation in the surface, the more samples will be required for a repeatable measurement.

My instrument always reads the same

If the instrument is used in the wrong range, it can become oversaturated. This occurs when measurements on mirror-like surfaces (130+GU @60°) are taken using the black range. To get accurate results on a mirror-like surface, the range must be set mirror or auto in the measurement menu.

My instrument is displaying an error

The first thing to try with an error is pressing the reset button. This is in a recess on the base of the instrument, near the serial number sticker.

Image showing the reset button location on the underside of a Rhopoint IQ

Some versions of firmware will power off as soon as an error is encountered. This means that the fixes below will not be possible. In this case, the instrument will need to be returned to Rhopoint.

CodeMeaningCause
1Cannot open config.iniFile system corrupt or Dataflash fault.
2Cannot write config.iniFile system corrupt or Dataflash full.
3Cannot read config.iniFile system corrupt.
4Corrupt data config.iniFile data corrupt.
5Cannot open calib**.datFile system corrupt or Dataflash fault.
6Cannot write calib**.datFile system corrupt or Dataflash full.
7Cannot read calib**.datFile system corrupt.
8Error saving dataUnable to create/write to results file. Dataflash full or faulty.
9Error reading foldersFile system fault, Dataflash probably corrupt.
10RTC oscillator failureMain board hardware failure.
11Cannot create bstats.datDataflash full or faulty.
12Cannot open bstats.datFile system corrupt or Dataflash fault.
13Cannot write bstats.datFile system corrupt or Dataflash full.
14Cannot read bstats.datFile system corrupt.
15Cannot open sysdat.binUnable to open file – UC3B flash corrupt.
16Cannot write sysdat.binFile system corrupt or Dataflash full.
17Cannot read sysdat.binFile system corrupt.
18Cannot open log.txtFile system corrupt or Dataflash fault.
19Cannot write log.txtFile system corrupt or Dataflash full.
20Cannot open cf.binFile system corrupt or Dataflash fault.
21Cannot write cf.binFile system corrupt or Dataflash full.
22Cannot read cf.binFile system corrupt.
23Scanner micro failureFailure to connect to scanner.
24Error saving stats dataUnable to create/write to stats.csv. Dataflash full or faulty.
25Cannot open passfail.datFile system corrupt or Dataflash fault.
26Cannot write passfail.datFile system corrupt or Dataflash full.
27Cannot read passfail.datFile system corrupt.
28Corrupt data passfail.datFile data corrupt.
29Cannot open summary.csvFile system corrupt or Dataflash fault.
30Cannot write summary.csvFile system corrupt or Dataflash full.
31Cannot delete summary.csvFile system fault, Dataflash probably corrupt.
32Undefined errorMain board hardware error.

Error codes 1-4

Delete config.ini:

  • Make a note/take a photo of the settings selected in the menu
  • Connect the instrument to the PC
  • Make sure hidden folders and system files are visible (control panel -> folder options -> view)
  • Navigate to the instrument (Computer -> IQ-METER)
  • Open the SYSTEM folder
  • Delete config.ini
  • Restart the instrument
  • Check to see if any settings have changed, put them back if required

Error code 2

Error code 2 can be caused by full memory.

  • Connect instrument to PC
  • Open DATA folder and back up any measurement data required
  • Select “Delete all batches” from the menu

Error codes 5-7

This error must be resolved by an accredited service agent.

Error code 8-14

Check to see if memory is full – if so, delete readings. They can be backed up and archived with a PC. If this problem persists, or the memory was not full, then the instrument must be returned to an accredited service agent.

Error code 15 – 17

For error code 16, make sure the memory is not full. If this does not resolve the error, then the instrument must be returned to an accredited service agent.

Error code 18 & 19

  • Connect the instrument to a PC via USB
  • Delete log.txt and restart the instrument

Error code 20 – 22

For error code 21, make sure the memory is not full. If this does not resolve the error, then the instrument must be returned to an accredited service agent.

Error code 23

First, press the reset button.

For instruments manufactured after June 2023, the following procedure should resolve the issue:

  • Ensure the instrument has at least some charge.
  • Power on the instrument.
  • Press the power button for one second, then release for one second. Repeat this at least 6 times. Please note – it can take up to ten times until the instrument switches off due to the timing and possible missed presses.
  • Switch off indicates the power reset procedure has been successful.

If the issue continues, please contact an accredited service agent.

Error code 24

The instrument must be returned to an accredited service agent.

Error codes 25 – 28

For error code 26, make sure the memory is not full. If this does not resolve the error, follow the rest of this procedure.

  • Make sure system files and hidden folders are visible (control panel -> folder options -> view)
  • Delete passfail.dat from the SYSTEM folder on the instrument
  • Restart the instrument and retest

Error codes 29 – 31

For error code 30, make sure the memory is not full. If this does not resolve the error, follow the rest of this procedure.

  • Back up the DATA folder if required
  • On the instrument select “Delete All Batches”
  • Restart the instrument
  • If the error is not resolved, then the instrument must be returned to an accredited service agent

Error code 32

The main board requires replacing – return to Rhopoint.

My instrument is stuck in a measurement loop

Measurement loops occur when the instrument cannot decide whether the surface it is measuring is a mirror or black gloss surface. The crossover is at ~130GU. In the measurement menu, “Range” can be set to “BLACK”, “MIRROR” or “AUTO”. If the sample you are measuring is in the crossover zone, try setting the range manually.

More recent versions of firmware handle switching between ranges better. You can contact an accredited service centre for details about whether there is a firmware upgrade available for your instrument.

This error can also be caused by calibration – if the black range is calibrated on a mirror surface, or vice versa, then this problem can occur. Enter the calibration menu, and make sure “Range” is set to “BLACK”, then calibrate the instrument on the supplied black tile. If a calibrated mirror tile is available, repeat this process for the mirror range.

My instrument shuts down after taking a measurement

In older versions of firmware, the instrument shut down after experiencing a fatal error. In this case, the instrument’s memory is usually full. Make sure you have backed up any important measurements to a computer with the USB connection. Switch the instrument on, and in the menu, select “Delete All Batches”.

If this does not resolve the issue, the instrument will require repair with an accredited service centre.

You can contact an accredited service centre for details about whether there is a firmware upgrade available for your instrument.

Buttons are not responding or pressing themselves

During power-up, the instrument takes an average of the input to each button to use as a baseline. This means that if your fingers or other conductive objects are near the buttons during power-up, it can affect their operation.

What is the MFFT?

Minimum Film Forming Temperature ( MFFT ) is the lowest temperature at which a latex, emulsion or adhesive will uniformly coalesce when laid on a substrate as a thin film. An accurate MFFT value allows the formulation of products that cure correctly under specified application conditions.

Do I need to Calibrate the MFFT?

The instrument operation is governed by precision temperature sensors which are mounted on the reverse of the measurement platen. The output of these sensors is referenced to precision resistors which are extremely stable with time and different ambient conditions

It is because of this the instrument is completely self calibrating and regulating.

Rhopoint glossmeter comparison table

Rhopoint Products 20º Gloss 45º Gloss 60º Gloss 85º Gloss Haze (Reflectance) Orange Peel RSpec Flat surface Curved surface Surfaces with curvature
Novo-Gloss 60 Glossmeter                
Novo-Gloss Trio 20/60/85 Glossmeter            
Novo-Gloss 20/60/85 Glossmeter with Haze to ASTM E430          
Rhopoint IQ 20/60 Gloss Haze DOI Meter      
Rhopoint IQ 20/60/85 Gloss Haze DOI Meter    
New Rhopoint TAMS    
Optimap3    
Concrete Clarity Meter (CCM)        
Novo-Curve Glossmeter            
Novo-Gloss Flex 60 Glossmeter            
Novo-Gloss 45 Glossmeter                

Rhopoint ID measurements correspond more closely to visual assessment

The Rhopoint ID captures and analyses an image of the sample placed in front of a backlit target. This approach matches how an observer views a material and the clarity of an object viewed through it.

Traditional haze-meters measure light scattering, an indirect measurement of appearance that does not fully capture the optical transmission properties of a material.

The Rhopoint ID Haze and Sharpness fully describes the transmission appearance of plastics, glass and liquids

The Rhopoint ID fully describes the optical characteristics of a sample and how an object will appear when viewed through it.

  • ID Haze (H) describes the contrast of viewed object
  • ID Sharpness (ID) describes blurriness of the viewed object
  • ID Transmission measures the brightness of an object viewed through the material.
  • ID Haze can be measured at different separation distances between the material and object to match the user’s application

Traditional instruments often only measure haze- this parameter alone is not enough to describe the optical suitability of a material.

The Rhopoint ID provides a better defined, more flexible measurement of Haze

The Rhopoint ID measures Haze by quantifying the contrast of a target graticule viewed with the material in contact or with variable airgaps.

The effect of sample-object separation is important- a material can appear fully transparent with perfect contrast at a certain distance but will completely obscure (no contrast) an object with a small increase in displacement.

At 8mm the Rhopoint ID Haze measurement directly correlates with ASTM D1003 Haze.

The Rhopoint ID directly measures Haze in a method that matches the end user application and correlates closely with the visually experience.

The Rhopoint ID Transmittance (Visible transmittance) is a much more relevant measurement than Traditional Hazemeter Transmittance (Total Transmittance)

Rhopoint Transmittance (TID) quantifies the amount of light passing through the material and reaching the camera/eye of the observer. This measurement describes the brightness/luminosity of the viewed object and is correlated to how one perceives the quality of the material.

Total Transmittance from a traditional instrument quantifies absorption within the material and is not related to its appearance to an observer.

The Rhopoint ID measures Haze and Sharpness in a single measurement

The instrument is configured to measure Haze (ASTM) and sharpness in a single measurement. Simultaneous measurement is much faster and more convenient than a traditional instrument where the sample is measured in two separate operations.

Rhopoint ID is much faster and easier to use than a traditional Haze-Clarity meter.

The Rhopoint ID quantifies directionality

The ID(L) software splits the measurement graticule into 7 separate ID measurement areas and 3 transmission zones allowing horizontal and vertical characteristics to be isolated and variation between the zones compared.

Traditional Haze and Clarity meters can only average results over a large area- it is not possible to measure directionality.

The Rhopoint ID is the only instrument that can assess directionality in a measured sample.

The ID measures small parts

The ID uses a glass target graticule with small sub-measurement zones. The transmission of a single 4x4mm square can be measured- ID can be assessed on a single area of 6x2mm. Traditional Haze and Clarity meters can only measure parts bigger than 20mmx20mm and have an open port into the instrument.

The Rhopoint ID is more suited to small parts than a traditional instrument.

The ID measures non-flat parts

The ID method has been tested on non-flat samples such as PET bottles- once cut different areas of the bottles can be measured easily without the need deform or bend them during measurement.

Measurements of non-flat parts is not possible using the traditional haze method.

The Rhopoint ID has live live view helps locate a measurement area

The ID (L) software includes a LIVE camera view allowing samples to be positioned in real time- it’s easy to “sharpie mark” an area of interest and manipulating the sample on-camera to the measurement area.

The Rhopoint ID live view makes it easy to measure areas that cannot be accessed on a traditional Hazemeter.

The Rhopoint ID platen is sealed and can be used with liquids

The top platen of the ID and is designed to have liquids placed directly in contact- ideal for using refractive index matched liquids when analyzing the effects of sample roughness on plastic films.

The Rhopoint ID allows fast easy assessment of the effects of sample roughness.

Rhopoint ID measurement images help people understand appearance & quality

The ID (L) software displays high resolution images of each measurement with a build in visual comparison scale and can be overlaid with measured values. These images directly represent how a sample and object will look under real life conditions and can also record evidence of scratches, voids and imperfections. The software allows multiple images to be opened simultaneously to compare the optical characteristics for different tests or materials.

Rhopoint ID software provides detailed images which help customers really understand the see-through characteristics of materials.

Rhopoint ID software makes report writing easy

The ID-L is supplied with integrated software that operates the instrument, batches information, calculates statistics, produces graphs and shows measurement images, all elements can be dragged and dropped into reports and excel documents.

All ID data can be saved and recalled for quality assurances.

Rhopoint ID software provides an unbeatable combination of measurements, images, graphs and statistical analysis.

Rhopoint IDs are networkable.

Multiple instruments can be installed and connected to a LAN, ID software is free to install on multiple computers so any computer can run and interrogate results from any instrument.

Fast data sharing and remote operation is possible with Rhopoint ID instruments.

Flexible measurement for multiple applications

The ID meter can measure virtually any planar (sheeted material), it is also possible to measure liquids too.

Haze and Clarity meters often require the purchase of additional attachments for alternative applications.

ID measurement is ready for industry 4.0/in-line measurement

Rhopoint ID measurement is designed for fast inline measure as measurement can be fully non-contact and work at fast line speeds. Sphere instruments are only suited for laboratory measurement.

Rhopoint ID measurement is ready for migration into an inline environment.

The Rhopoint ID represents the cutting edge of measurement technology

Rhopoint ID measurement technology was developed and patented by the materials department of ETH University in Zurich and exclusively licensed to Rhopoint instrumentation.

ID Technology represents a breakthrough in transmission measurement developed in one of the words most prestigious materials analysis departments.

Read the research article: Imaging-Based Metrics Drawn from Visual Perception of Haze and Clarity of Materials. I. Method, Analysis, and Distance-Dependent Transparency

The Rhopoint ID is incredibly good value for money

The Rhopoint ID uses modern imaging techniques to measure appearance- this make is much less complicated and cheaper to manufacture than a complicated haze meter with moving parts and an expensive integrating sphere.

A fully loaded ID meter will cost approximately half as much to buy compared with a Haze and Clarity meter.

No moving parts
Eliminates risk of mechanical failure
Stand-alone instrument
Small footprint reduces space required in laboratory
Lightweight
Easy to move in the laboratory or production line
Resistant and durable
Made from durable, recyclable materials

The ID is great at measuring abraded TABER abraded samples

Rhopoint ID Taber results are compatible with traditional measurements made on other instruments.

Measurement is faster and easier using the Rhopoint TABER abrasion adaptor- the adaptor is much less expensive than the comparative add on for competitive instruments.

FAQ categories

Related products

Appearance Measurement